These Frequently Asked Questions (FAQs) are based on the knowledge and experience of the developers and practitioners of the Highway Safety Manual, as well as various publications and websites, including the Federal Highway Administration’s Crash Modification Factor Clearinghouse, and more. FAQs are sourced from the Highway Safety Manual Frequently Asked Questions compendium, developed by the Transportation Research Board – Highway Safety Performance Committee’s (ANB25) User Liaison and Technology Facilitation Subcommittee. A
PDF of the latest version of this document (June, 2018) can be found here.
Overview
Background
What Is the Highway Safety Manual, and Why Was It Developed?
The Highway Safety Manual (HSM) provides practitioners with information and tools to consider safety when making decisions related to design and operation of roadways. The HSM assists practitioners in selecting countermeasures and prioritizing projects, comparing alternatives, and quantifying and predicting the safety performance of roadway elements considered in planning, design, construction, maintenance, and operation. Prior to the HSM, there was no widely accepted tool available to quantitatively assess the impact of infrastructure decisions on safety.
Where Can I Find an Overview of the HSM?
The Highway Safety Manual website,
www.highwaysafetymanual.org, has an Introduction or “primer” on the HSM, as well as a
fact sheet and
brochure.
Is the HSM Required?
Each state department of transportation can set its own policy related to use of the manual, if desired. The Federal Highway Administration does not require use of the Highway Safety Manual. The HSM is a tool to help practitioners perform data-driven safety analyses of roads, and is not a standard or a requirement.
Who is The Targeted User of the HSM?
The target users for the HSM are primarily managers, executives, and practitioners from the following five key groups:
- Management – Professionals and managers from transportation administration and other decision-makers;
- Planners – Those involved in developing long- and short-term transportation plans, corridor studies, environmental assessments, and alternative assessments;
- Designers – Individuals who do project scoping, preliminary, and final design, including alternative comparisons;
- Operations & Maintenance – Individuals who conduct operational analysis and determine the condition of the roadway pavement, guardrail, signing, etc.; and
- Safety Analysts – Individuals responsible for collecting and analyzing roadway safety data, system safety performance reviews, crash investigations, safety assessments and audits, and/or countermeasure selection.
It’s expected that the target users for HSM should have a safety knowledge base that includes familiarity with general highway safety principles, basic statistical procedures, and interpretation of results, along with suitable competence to exercise sound traffic safety and operational engineering judgment.
How Is the Highway Safety Manual Related to the AASHTO Green Book and Roadside Design Guide?
The Highway Safety Manual provides information and tools for incorporating data-driven consideration of safety into the project planning and development process. The manual allows for determining the impacts of design and other decisions on the expected safety performance of a facility. The AASHTO Policy on Geometric Design of Highways and Streets (the “Green Book”) and Roadside Design Guide are publications that present current information on design and operating practices that are in universal use in the United States. Where these publications present recommended ranges of values for given elements in the roadway or roadside environment, the HSM allows for determining the expected safety impact of using a specific value over another value.
How Is the Highway Safety Manual Related to the Manual of Uniform Traffic Control Devices?
The AASHTO Highway Safety Manual (HSM) presents a variety of methods for quantitatively estimating crash frequency or severity at a variety of locations. The manual allows for determining the impacts of traffic signs, roadway surface markings and signals on the expected safety performance of a facility.
The Manual on Uniform Traffic Control Devices (MUTCD) is a document issued to specify the standards by which traffic signs, road surface markings, and signals are designed, installed, and used. These specifications include the shapes, colors, and fonts used in road markings and signs. The manual is used by state and local agencies as well as private construction firms to ensure that the traffic control devices they use conform to the national standard. Where the MUTCD presents recommended traffic control devices in the roadway or roadside environment, the HSM allows for determining the expected safety benefit of using certain traffic control devices over other devices. This means that where the MUTCD advises engineering judgement be used to determine the selection of certain traffic control device options, the HSM can help supplement that judgement with data-driven insights into relative safety performance.
How Is the Highway Safety Manual Related to the Human Factors Guidelines for Roadway Systems?
The Human Factors Guidelines for Roadway Systems (HFG) is a roadway design resource that provides data and insights from the scientific literature on the needs, capabilities, and limitations of road users, including perception and effects of visual demands, cognition and influence of expectancies on driving behavior, and individual differences including age and other factors. The HFG is a valuable tool in providing information about how road users operate in the driving environment.
The Highway Safety Manual (HSM) provides highway engineers with a synthesis of validated highway research and proven procedures for integrating safety into both new and improvement projects. The HSM can be used to develop possible design alternatives to improve safety on an in-service or planned intersection or section of roadway.
The HSM and the HFG promote improved safety for highway users and complement each other. The HFG can be used concurrently to identify design solutions or to enhance the alternatives suggested by the HSM. While the HSM includes one section of a chapter on human factors, it provides only a broad scope and not guidelines. However, the synthesis of validated highway research, as outlined in the HSM, makes indirect use of many human factor related impacts inherent in the highway research.
Where can I find information on Guidelines for Crash Testing Safety Hardware?
Resources for this include the
Manual for Assessing Safety Hardware and the earlier
NCHRP Report 350: Recommended Procedures for the Safety Performance Evaluation of Highway Features. The HSM does not evaluate the specific performance of roadside safety hardware.
What are the types of safety and operational analytical tools that can be used in Performance Based Practical Design (PBPD)? What tools would be appropriate?
In recent years, agencies have established increasingly flexible project design criteria. The Federal Highway Administration (FHWA) has encouraged PBPD in an effort to ground cost-saving design decisions in a performance-management framework. PBPD can be articulated as modifying a traditional design approach to a "design up" approach where transportation decision makers exercise engineering judgment to build up the improvements from existing conditions to meet both project and system objectives. PBPD uses appropriate performance-analysis tools, and considers both short and long-term project and system goals while addressing project purpose and need. [13]
The Interactive Highway Safety Design Model (IHSDM), the Enhanced Interchange Safety Analysis Tool (ISATe), and other tools support PBPD via implementation of HSM Part C predictive methods to estimate a project’s substantive safety. FHWA’s PBPD website provides case studies which illustrate use of tools to quantify performance:
https://www.fhwa.dot.gov/design/pbpd/case_studies.cfm.
Several agencies have used the Interactive Highway Safety Design Model (IHSDM) to evaluate and optimize their design decisions. For example, an agency determines that the elimination of shoulders and a reduction in lane widths from 12 ft. to 10 ft. will add space for a needed turn lane without the need to acquire right-of-way. Using the IHSDM Crash Prediction Module (CPM), the agency can apply HSM Part C methods to weigh the overall safety impacts of reducing lane and shoulder widths (which may increase lane departure crashes) and adding a turn lane (which may reduce crashes for turning vehicles).[21]
In general, several tools are available that enable a wide variety of performance analyses to be conducted. The tools available range from simple to complex and can be scaled to fit a wide range of geometric design scenarios. These tools can model existing conditions or predict future conditions. The most appropriate type of tool to be used for a particular analysis will be based upon the following factors:
- The stage of the project development process (i.e., planning, preliminary design, or final design).
- The availability and quality of pertinent data.
- The complexity of the design (e.g., rural versus urban, or single lane versus multi-lane).
For analyzing safety performance, refer to the 2010 AASHTO Highway Safety Manual (HSM) and FHWA's HSM website (http://safety.fhwa.dot.gov/rsdp/hsm.aspx).
For analyzing operational performance, refer to the Highway Capacity Manual and FHWA's Traffic Analysis Tools website (http://ops.fhwa.dot.gov/trafficanalysistools/index.htm).
Also see Chapter 6 (FAQ for HSM-Related Tools) of this document for more information.
Can a State Department of Transportation Use Federal Highway Safety Improvement Program Funds to Purchase the HSM?
FHWA has provided this information related to use of HSIP funds for the HSM:
Since the publication of the Highway Safety Manual (HSM), the FHWA Office of Safety has received a few inquiries concerning the eligibility of Highway Safety Improvement Program (HSIP) funds to support HSM implementation activities. Questions such as this are handled on a case by case basis. While the law (23 U.S.C. 148) and regulation (23 CFR 924) governing the HSIP lists transportation safety planning and improvement in the collection and analysis of safety data as eligible highway safety improvement projects, these activities must directly support HSIP implementation efforts.
States may also leverage other federal-aid funds to support HSM implementation efforts. For example, state planning and research funds can be used to support data collection efforts. In addition, training is an eligible expense under core federal-aid programs. Improvements to the collection and analysis of safety data can also be funded by NHTSA Section 402 and 408 State Highway Safety Grant Programs. CFR Title 49 Part 350 Commercial Motor Carrier Safety Assistance Program also has limited applicability for commercial motor vehicle involved crashes.
Several States have used HSIP funds for HSM implementation and related projects. However, every situation is unique and you should direct questions regarding HSIP eligibility to your state’s FHWA Division Office or Karen Scurry in the FHWA Office of Safety at 609-637-4207 or
karen.scurry@dot.gov.
Technical Assistance for HSM
Where Can I Find Information on HSM Training?
The Training page of the HSM website has information on HSM courses currently available and under development. The National Highway Institute of FHWA has several courses related to the HSM. State departments of transportation can contact their FHWA Division Office for training assistance. Additional assistance on HSM training could also be requested through the Local Technical Assistance Program (LTAP). For example, three tutorial videos have been created through the Michigan LTAP to familiarize users with operation of the HSM analysis spreadsheet.
Are there available trainings related to the application of CMFs?
The National Highway Institute offers training resources on Crash Modification Factors. Please visit the Resources Section at
cmfclearinghouse.org to find out more on available trainings.
Can I Download the FHWA Webinar Recordings?
The recordings of the FHWA webinar series are posted on the
HSM website. If you’re unable to view these recordings online, send a message to
highwaysafetymanual@aashto.org for assistance.
Where can I get help with the Manual?
You can send questions on the Manual to
highwaysafetymanual@aashto.org. Questions from both sources are passed along to technical experts for answers if needed. As new technical resources are developed, they will be posted on the HSM website on the Technical Support page. HSM users can also reach out to the FHWA resource center (https://www.fhwa.dot.gov/resourcecenter/teams/safety/) for any questions related with application of the HSM.
Where Can I Find Other HSM Users?
The Transportation Research Board Safety Performance and Analysis Committee (ACS20) fosters collection and innovative use of diverse safety data, and the development of new theories and analytical methods to advance the science of safety to meet the needs of future technologies and road users. This committee has a
website for HSM research and other information it develops and promotes. The committee meets during the annual TRB meeting in January and also holds a mid-year meeting; these meetings are open to all.
Where can I find HSM Sample Problems?
The HSM contains sample problems throughout Parts B and C. FHWA’s “Scale and Scope of Safety Assessment Methods in the Project Development Process” document (https://safety.fhwa.dot.gov/hsm/fhwasa16106/) provides a number of sample (example) problems. Some HSM-related tools also contain sample problems. For instance, FHWA’s IHSDM (www.ihsdm.org) includes a tutorial with many sample problems illustrating applications of HSM Part C methods via the IHSDM Crash Prediction Module.
Where can I find HSM Case Studies?
FHWA’s Roadway Safety Data Program (RSDP) website includes a Highway Safety Manual page (https://safety.fhwa.dot.gov/rsdp/hsm.aspx) with several HSM Case Studies. FHWA’s “Scale and Scope of Safety Assessment Methods in the Project Development Process” document (https://safety.fhwa.dot.gov/hsm/fhwasa16106/) provides some case studies. In addition, FHWA’s IHSDM website (www.ihsdm.org) includes a User Applications page documenting case studies, including HSM Part C applications.
How can I justify the need of the HSM to management?
The FHWA has developed several resources to assist states with HSM implementation efforts. Please refer to the HSM Implementation Guide for Managers for additional information:
http://safety.fhwa.dot.gov/hsm/hsm_mgrsguide/
How can data gained from implementation of the HSM be a benefit to other areas of the department?
The FHWA has developed several resources to assist states with HSM implementation efforts. Please refer to the FHWA Office of Safety website for additional information:
http://safety.fhwa.dot.gov/rsdp/hsm.aspx. The HSM Implementation Guide for Managers and HSM Integration Guide may provide additional information.
Future Edition Highway Safety Manual
Where do I find /send potential errata?
All Errata are posted on the HSM website. Please submit information on potential errors in the HSM to
highwaysafetymanual@aashto.org.
How do I suggest additions to the HSM?
If you have suggestions on material to add to the HSM, please send a message to
highwaysafetymanual@aashto.org.
When will the next edition of the Manual be published?
Publication of the second full edition of the HSM is anticipated around 2020. The AASHTO HSM Steering Committee and the TRB Highway Safety Performance Committee have worked together closely on a workplan for the second edition, developed under the NCHRP 17-71 project. This work plan helps to prioritize research needed for future editions. To develop new crash predictive tools for the second edition HSM, AASHTO funded the NCHRP 17-58 project to develop safety prediction models for six-lane and one-way urban and suburban arterials, the NCHRP 17-62 project to improve the crash severity and collision type prediction models, the NCHRP 17-68 project to update the intersection crash prediction models, and the NCHRP 17-70 project to develop the crash prediction models and methods for roundabouts. The AASHTO HSM Steering Committee, TRB Highway Safety Performance Committee and NCHRP project managers are coordinating these research efforts to ensure that results from these research projects could be incorporated into the next edition HSM.
FHWA’s
Crash Modification Factor Clearinghouse will periodically post new CMFs – new research is reviewed quarterly to identify CMFs for posting. You can also submit CMFs to be added to the database on the Clearinghouse website at
www.cmfclearinghouse.org. The Clearinghouse contains information on the
relationship of the CMFs on the website to those published in the HSM.
Roadway Safety Management Process (Part B)
Network Screening (Chapter 4)
What is the difference between safety performance function (SPFs) for Part B network screening versus SPFs for Part C predictive methods?
The primary differences between Part B SPFs designed for network screening and Part C SPFs designed for predictive safety analyses include the level of specificity and the complexity of data needs. Part B SPFs model general roadway types and are typically more high-level and require less data to develop and to deploy than Part C SPFs, which model more specific roadway types using base conditions and crash modification factors. As a result, Part B SPFs are simpler to apply over a large roadway network during the network screening processes, though the results are less precise. Part C SPFs on the other hand are more complicated and require more resources to apply, making them better suited for use in project-level predictive safety analyses where a higher level of precision based on design elements is needed.
Should minimum segment lengths be established for use in HSM Part B analyses?
The HSM doesn’t explicitly offer a minimum segment length to use for Part B analyses. However, in cases where segment lengths are shorter than the screening window length for the analysis method the results may be misleading. Aggregating similar, homogenous segments prior to conducting network screening (to reduce the number of short segments) will typically offer better performance. Analysts should identify and assess issues with short segments in screening results and determine if the short segments should be removed from consideration or if segment aggregation could mitigate any problems that arise.
How should crashes of different severities be considered in roadway network screening process?
In roadway network screening process, crashes of different severities could be considered with either of the following two methods. The first method is to develop SPFs for all crash severities; correspondingly, the predicted crashes will be calculated for all severities, and number of crashes under each severity could be determined by multiplying the total crashes with the relevant crash severity distribution or severity distribution function. The second method is to develop SPFs for each crash severity or for a specific set of crash severities (e.g., fatal, fatal and serious injury crashes, fatal and all injury crashes, etc.) to predict the focus severities directly.
Additionally, to help focus the network screening analysis on fatal and severe injury crashes, a couple methods can be employed. A weighting factor can be applied to crashes under different severities to produce a weighted crash frequency (e.g., a weighting factor of 25 for fatal crashes, 10 for incapacitating injury crashes, and 1 for non-incapacitating injury crashes). Alternatively, equivalent property damage only (EPDO) factors can be applied to crashes by severity to determine a weighted crash frequency. EPDO factors indicate the equivalent cost of a crash in terms of property damage only (PDO) crash costs. For example, if a PDO crash has an estimated societal crash cost of $10,000 and a fatal crash has an estimated societal crash cost of $10,000,000, then the fatal crash EPDO factor would be the quotient of the two, equal to 1,000. Each crash is weighted by severity, and the total EPDO crash index is determined by adding the weights of all crashes at the site.
Diagnosis (Chapter 5)
Should diagnostic analysis be performed only at locations showing elevated frequency or severity of crashes reflected by SPF?
Diagnostic analysis should be performed on every project, because crash patterns susceptible to correction may exist with or without elevated frequency or severity of crashes reflected by SPF analysis. Every project presents an opportunity for possible safety improvement that can be discerned through diagnostic examination. A medical analogy offers a way of thinking about network screening and diagnostics. Vital signs, such as elevated body temperature can be thought of as a network screening using SPF, x-ray, blood tests, cardiograms etc. can be thought of as diagnostic examination using pattern recognition analysis of various crash attributes. It is important to realize that just as a patient may have a pathology not reflected by vital signs, a correctable crash pattern may exist with or without elevated frequency or severity of crashes detected by the SPF.
How can CMFs be used / applied in the Countermeasure Selection process? (What is the role of CMFs in the Countermeasure Selection process?)
In this step, potential countermeasures are developed to address the contributing factors identified in the safety diagnosis. Physical, financial, and political constraints need to be taken into consideration during this task as well as the potential impacts on safety, mobility, and the environment. CMFs can provide valuable information to assist in the countermeasure selection process, particularly the quantification of safety impacts.
With respect to countermeasure selection, CMFs can play a valuable role by indicating which candidate treatments are associated with the greatest expected reductions in crashes. From the diagnosis step, a list of contributing factors is generated. The first step in the countermeasure selection process is to identify a list of potential countermeasures to address the specific contributing factors. Contributing factors and related treatments are identified in HSM 6.2.2 and the NCHRP Report 500 Series [4] for several specific topics.
CMFs can help to reduce the list of potential treatments to more manageable levels by grading the treatments in terms of expected safety effectiveness. Those treatments with CMFs less than 1.0 are likely to result in a reduction in crashes, and can be carried forward for further evaluation, while treatments with CMFs greater than or equal to 1.0 may be eliminated from further consideration.
The CMF alone is not always enough information to immediately include or discount a treatment from further consideration. CMFs are developed using various study designs, sample sizes, and study periods. As such, there is a wide range in the quality and reliability of CMFs. The standard error of a CMF should be considered as it indicates the potential variability in the estimate. The standard error can be used to define a confidence interval which indicates the range of values that contain the true treatment effect with a given level of confidence. A CMF confidence interval which includes 1.0 suggests that a treatment is not highly effective and may be completely ineffective. Consequently, it would be reasonable to give less consideration to treatments for which the associated CMF has a confidence interval that includes 1.0. Furthermore, it may be prudent in some situations to give greater consideration to treatments with smaller confidence intervals because of the greater level of certainty in the results.
(FHWA’s Quick Start Guide to Using CMFs)
Economic Appraisal (Chapter 7)
How can CMFs be used and applied in the Economic Appraisal process? What is the role of CMFs in the Economic Appraisal process?
The economic appraisal step of the highway safety management process seeks to compare the benefits of safety improvements to the costs of implementing those improvements. There are two main types of economic appraisals: benefit-cost analysis and cost-effectiveness analysis. In benefit-cost analyses, the safety benefits of potential treatments are translated into monetary values and then compared to treatment costs. In contrast, a cost-effectiveness analysis does not convert safety benefits into monetary terms. Instead, the cumulative treatment costs are divided by the estimated number of reduced crashes to approximate the cost per crash reduced. CMFs may be utilized in either type of analysis to estimate the reduction in crashes.
With respect to the economic appraisal, the main function of CMFs is to help estimate the benefits of proposed treatments as part of benefit-cost or cost-effectiveness analyses. Depending on which type of economic appraisal is conducted, benefits may be quantified in different forms. In a benefit-cost analysis, benefits are measured in terms of monetary values. Specifically, estimated crash reductions are converted to monetary values using average crash costs. In a cost-effectiveness analysis, benefits are quantified simply as the estimated reduction in crashes. In either case, CMFs are used to estimate the change in crash frequency associated with proposed treatments.
What economic measures indicate whether a project is economically justified?
A common performance measure for whether or not a project is economically justified from a safety perspective includes a benefit-cost ratio of greater than 1.0 as well as a net present value of greater than zero dollars. All life-cycle costs and safety benefits (i.e., avoided crash losses, injuries prevented, etc.) should be considered when determining a project’s benefit-cost ratio or net present value. For a more comprehensive economic analysis, operational, environmental, and other costs and benefits can be considered, though these are beyond the scope of the Highway Safety Manual.
It is important to note that economic justification does not automatically warrant a project’s funding and construction. All economically justified projects should be prioritized and ranked against other projects to determine the set of potential projects representing the best possible investments across a roadway network.
How can economic appraisal methods be used for budget setting?
Economic analyses can be used to set budgets during early stages of exploring proposed projects and selecting final countermeasures. When planners or designers are trying to select treatments and develop alternatives that meet a minimum benefit-cost ratio, they can use various CMFs to determine the allowable budget at each level of crash reduction. Safety benefits are typically determined by multiplying the existing crash frequency by the crash reduction determined by a CMF. If the desired benefit-cost ratio and crash reduction are known, and the site has a given crash frequency, then the cost (i.e., budget) can be determined by solving for the cost variable in the benefit-cost ratio equation. Analysts can iterate situations with several CMFs to determine maximum budgets for each situation to achieve the desired benefit-cost ratio.
What are the impacts of using observed crash frequency in economic analyses?
Using observed crash frequency may overestimate the long-term average frequency of less common crash severities and types (e.g., fatal and serious injury crashes). For example, considering a five-year crash history, sites with fatal crashes can never have less than 0.2 fatal crashes per year (i.e., one fatal crash over the five years). It is unlikely that most sites will continue to have at least one fatal crash every five years in this manner. Given a fatal crash unit cost of $10,000,000, the minimum fatal crash unit cost that at a site could have is $2,000,000 per year due to the relatively short-term average and the fact that only whole numbers of crashes occur. The annual cost of just one fatal crash is equal to many lower severity crashes. This imprecise estimation of fatal crash frequency is the source of perceived a bias caused by a high fatal crash unit cost in determining safety benefits. However, SPFs can more accurately predict a long-term average fatal crash frequency (e.g., in the order of 0.02 fatal crashes per year, yielding $200,000 annual crash costs and eliminating this perceived bias) based on data from potentially thousands of site-years at similar locations.
Using the EB method to combine the observed crash history of a given site with the crash prediction from an appropriate SPF is a more reliable way to estimate the long-term average frequency of crashes; however, in some cases, the predicted crash frequency alone is more appropriate. If a long-term average observed crash history is available (e.g., 10 or more years) with mostly unchanged conditions at the site, using the longer period is recommended when applying observed crash frequency in safety BCA. However, although the data may be available, it can be difficult to account for other changes over time without SPFs.
Should economic or comprehensive crash costs be used in economic ANALYSES?
The comprehensive cost of crashes should be used in economic analyses to capture the full burden of crashes on the public.
Can certain crash types or severities be ignored in economic analyses?
No—all crash types and severities should be included in economic analyses. Ignoring some crash types and severities can be conservative when projects reduce those crashes; however, when countermeasures increase these crash types or severities the impacts on the project must be considered. The best practice is to include all crash types and severities in economic analyses for completeness and consistency.
How should weighted crash costs be determined?
Weighted crash costs (e.g., the cost for an average fatal or serious injury crash) should be determined by calculating the weighted average of the costs for each individual crash severity. A minimum of five years of crash data (or fewer if prior years are not representative of future years) should be used to calculate the severity distributions. For example, consider a fatal crash cost of $10,000,000, serious injury crash cost of $1,000,000, and an average of 100 fatal crashes and 400 serious injury crashes occurring each year. The weighted fatal and serious injury crash costs is calculated as the sum of 20 percent of $10,000,000 plus 80 percent of $1,000,000, or $2,800,000.
What are the impacts of using weighted crash costs in economic analyses?
Weighted crash costs increase the value of lower severity crashes and decrease the value of higher severity crashes. Weighted crash costs should be calculated with the severity distribution for crashes to which they’re applied (e.g., use statewide severity distribution for developing and applying weighted crash costs within that state).
Can different crash costs be used for different purposes?
Yes, agencies can select and apply different crash costs for different purposes. However, it is important that the same set of crash costs be used in economic appraisals for projects that compete for the same funding so the projects are prioritized fairly. Additionally, agencies should strive to use the most updated and accurate crash costs available in all analyses.
What are the impacts of using conservative crash costs in economic analyses?
Conservativeness in crash costs typically implies using artificially lower crash cost values in analysis. Conservative crash costs can improve the chance that constructed projects meet a desired benefit-cost ratio and crash reduction. However, conservative crash costs do not account for the full burden of crashes, and some projects that may be economically justified with full crash costs may not appear justified with conservative costs. Regardless of whether conservative crash costs are applied, consistent crash costs should be used for all competing projects and alternatives.
Prioritize Projects (Chapter 8)
What is the ideal method to prioritize projects or alternatives within a budget?
The purpose of project prioritization is to rank projects or alternatives by their cost-effectiveness or magnitude of crash reduction to achieve the highest possible return on investment and net present value of a safety improvement program. To determine the most cost-efficient projects and alternatives within a budget, benefit-cost ratios should be used as the prioritization measure. This method is the default for prioritizing safety projects. Ranking projects by their benefit-cost ratios maximizes the net present value and benefit-cost ratio (i.e., return on investment) of the overall program.
What is the ideal method to prioritize the projects or alternatives with the largest crash reduction regardless of cost?
In some cases, prioritizing by benefit-cost ratios will yield projects or alternatives that do not provide a sufficient level of crash reduction (e.g., as determined by project stakeholders). To determine the projects and alternatives that provide the largest crash reduction (regardless of cost), net present value should be used as the prioritization measure. Analysts and stakeholders can consider less cost-efficient alternatives to achieve a higher level of crash reduction for a project, which may result in a loss of overall program effectiveness. If a lower crash reduction was acceptable at a lower cost (i.e., the more cost-efficient alternative), then the excess funding could potentially be allocated to another, more cost-efficient, project somewhere else in the network.
When should the incremental benefit-cost analysis method be used?
While calculated differently, net benefits and incremental benefit-cost analysis always produce the same priority ranking. The incremental benefit-cost analysis method is not necessary in practice and does not provide any additional insights into the relative priorities of projects compared to ranking by net present value. Question 3.4.4 discusses the use of net present value in project prioritization.
What are independent and mutually exclusive projects, and how do they affect prioritization?
Independent projects and alternatives are those that can be implemented regardless of whether other projects and alternatives are implemented (e.g., rumble strips and signing). Mutually exclusive projects and alternatives are those that cannot be implemented when others are implemented (e.g., a stop-controlled intersection can be converted into either a signalized intersection or a roundabout—not both).
Independent and mutually exclusive projects should be prioritized in the same manner, ranked by benefit-cost ratios.
Traditionally, independent projects have been ranked by benefit-cost ratio, assuming funds can be distributed to the most cost-efficient independent projects and alternatives. Mutually exclusive projects and alternatives have been ranked by net present value assuming the largest crash reduction is desired amongst mutually exclusive alternatives. However, net present value prioritization does not consider network-wide performance due to its limitations in comparing project costs.
Safety Effectiveness Evaluation (Chapter 9)
What is the role of CMFs in Safety Effectiveness Evaluation?
The safety effectiveness evaluation step of the roadway safety management process assesses how an implemented safety treatment or set of safety treatments affected the frequency and severity of crashes. During this step, evaluations of individual treatments or combinations of treatments can be carried out based on various performance measures. It is often possible to develop CMFs in this step of the process. If the goal is to develop CMFs, there are numerous study designs that can be utilized which have varying levels of complexity and quality. More information about the various approaches to develop CMFs can be found in
A Guide to Developing Quality Crash Modification Factors [5] and
Recommended Protocols for Developing Crash Modification Factors [6]. This step is intended to provide quantitative indicators of effectiveness in order to guide future highway safety decision-making and policy development.
Predictive Method (Part C)
Background
What are the limitations of current HSM Part C crash predictive models?
The HSM Part C crash prediction models provide transportation professionals with knowledge, techniques, and methodologies to quantify the safety-related effects of transportation decisions. The HSM Part C, however, still doesn’t include the crash predictive models for the following roadway facilities:
- Full impacts on non-motorists;
- All-way stop controlled intersections;
- Intersections with more than 4 legs;
- One-way streets;
- 3-leg signalized intersections on rural 2-lane/rural multilane roads;
- ETC/toll plazas on freeways;
- HOV/HOT lanes on freeways;
- Ramp metering on freeways.
Where can I find information on safety analysis for specific conditions such as animal crashes, Pedestrians and Bicycles, Parking, One-way Streets, and At-grade Rail Crossing?
1. Animal crashes?
The HSM provides default percentages of animal crashes for use in Part C predictive models. For rural two-lane roads, this information is in Chapter 10. Chapter 12 contains the information for urban and suburban arterials. For single-vehicle crashes on freeways and interchanges, the information is in Chapter 18 and 19. For rural multilane roads (Chapter 11), this information is not available. If percentages of animal crashes are available for a state or region for which an analysis is being performed, these values can be used instead of those provided by the HSM.
2. Pedestrians? Bicycles?
HSM information on non-motorized road users is included in Chapters 12, 13 and 14. Chapter 12 includes a pedestrian crash prediction method for signalized intersections, including SPFs and CMFs; pedestrian crash adjustment factors for stop-controlled intersections and segments; and bicycle crash adjustment factors for segments and intersections. Chapter 13, on crash modification factors for roadway segments, contains information on the expected impact of treatments related to pedestrians and bicyclists. There is not enough information available to develop crash modifications factors, but this chapter does contain information on trends. Chapter 14, on crash modification factors for intersections, provides the CMFs for several treatments, including converting minor-road stop control into an all-way stop control, removing unwarranted signals, providing intersection illumination, and permitting right-turn-on-red. For some other treatments (such as narrowing roadway at pedestrian crossing, installing raised pedestrian crosswalk and installing pedestrian signal heads at signalized intersection), there is not enough information available to develop CMFs, but this chapter does contain information on trends. The NCHRP 17-84 project is currently underway and will develop safety performance functions for pedestrian and bicycle crashes. This information is expected to be included in a future edition of the HSM once the project has been completed.
3. Parking?
While expected impacts of treatments related to on-street parking are discussed in the HSM (Part D, Chapter 13), many issues related to parking have not undergone the type of study necessary for inclusion in the HSM. An on-street parking CMF is part of the crash prediction method for urban/suburban arterials in Chapter 12.
4. One-way streets?
The HSM briefly discusses the expected impact of removing an unwarranted signal on a one-way street (Part D, Chapter 14) and converting one-way streets to two-way (Part D, Chapter 17). Predictive methods for one-way urban/suburban arterials were included in research sponsored by the National Cooperative Highway Research Program (project 17-58); these methods are candidates for inclusion in the HSM2.
5. At-grade rail crossings?
The HSM will provide some information on crash effects of treatments related to highway-rail grade crossing traffic control and operational elements (Part D, Chapter 16). There are crash modification factors for signs and markings, signals and gate (active and passive), and illumination. There are a few other treatments for which trends are discussed, but for which enough information was not available to provide a CMF. These treatments are strobes, four-quadrant gates, pre-signals, and constant warning time devices.
What is the difference between safety performance functions (SPFs) for network screening versus SPFs for prediction?
The primary differences between Part B SPFs designed for network screening and Part C SPFs designed for predictive safety analyses include the level of specificity and the complexity of data needs. Part B SPFs model general roadway types and are typically more high-level and require less data to develop and to deploy than Part C SPFs, which model more specific roadway types using base conditions and crash modification factors. As a result, Part B SPFs are simpler to apply over a large roadway network during the network screening processes, though the results are less precise. Part C SPFs on the other hand are more complicated and require more resources to apply, making them better suited for use in project-level predictive safety analyses where a higher level of precision based on design elements is needed.
Data Requirements and Preparation
is there a minimum length criteria for segments to be used in HSM Part C analyses?
There is no minimum segment length necessary for use in HSM Part C analyses to estimate the predicted crash frequency (Np). The procedures have been developed so they can be applied to homogeneous segments as long or short as necessary. If a project being analyzed includes numerous segments shorter than 0.1 mi, consideration might be given to using the project-level Empirical Bayes (EB) procedure rather than the site-specific EB procedure to determine the expected crash frequency (Ne) because the locations of observed crashes may not be sufficiently accurate for application of the site-specific EB procedure. The site-specific and project level EB procedures are presented in HSM Part C Appendices A.2.4 and A.2.5, respectively.
For SPF development, a minimum roadway segment length of 0.1 mi is desirable. Shorter roadway segments are undesirable because data on crash locations may not be accurate enough to assign each crash to the appropriate road segment. Thus, segments shorter than 0.1 mi should generally not be included in data bases for SPF development.
Are there advantages to having segments of a minimum length when using part c methods?
Part C provides the following guidance on this issue:
- “When dividing roadway facilities into small homogenous roadway segments, limiting the segment length to a minimum of 0.10 miles will decrease data collection and management efforts.” (p. 10-8)
- “When dividing roadway facilities into small homogenous roadway segments, limiting the segment length to a minimum of 0.10 miles will minimize calculation efforts and not affect results.” (p. 10-13)
Note: See
Chapter 6 – FAQ for HSM-Related Tools for more information on software tools for implementing HSM Part C which automatically divide roadway facilities into homogeneous segments (e.g., FHWA’s Interactive Highway Safety Design Model).
Is using estimated AADT values acceptable when applying HSM Part C Models?
In general, the application of the predictive methods depends on the number of crashes and accurate AADT estimates. Highway agencies generally have reasonable AADT estimates for roadway segments on the state highway system, though AADT values are sometimes unavailable for local roads. In these cases, estimates need to be made to provide exposure data for crash analysis tools. Overall, such estimates are acceptable, though it is critical to note that the better the estimates, the better the results.
For FHWA guidance on practices for properly estimating AADT values, refer to their 2015 report (https://www.fhwa.dot.gov/policyinformation/travel_monitoring/pubs/aadt/aadt_task_2_final_report_jan_2015.pdf).
For the Part C Predictive Methods, is there a minimum AADT that is needed to make HSM analysis valid?
Each of the Part C chapters (i.e., 10, 11, 12, 18, and 19) specifies the AADT volume range for each SPF. The range includes the minimum AADT volume and maximum AADT volume that the SPF’s developers believe are appropriate for the SPF based on consideration of the volume levels represented in the database used to develop the SPF. Estimates obtained from the SPF should be most reliable when the AADT of the subject site is within this range. Application of the SPFs to sites with AADT volumes substantially outside this range may not provide reliable results.
Under what conditions is it appropriate to apply the EB procedure?
As noted in HSM Volume 2, Section A.2.1 (Determine Whether the EB Method is Applicable): “If a future project is being planned, then the nature of that future project should be considered in deciding whether to apply the EB Method.
The EB Method should be applied for the analyses involving the following future project types:
- Sites at which the roadway geometrics and traffic control are not being changed (e.g., the “do-nothing” alternative);
- Projects in which the roadway cross section is modified but the basic number of through lanes remains the same (This would include, for example, projects for which lanes or shoulders were widened or the roadside was improved, but the roadway remained a rural two-lane highway);
- Projects in which minor changes in alignment are made, such as flattening individual horizontal curves while leaving most of the alignment intact;
- Projects in which a passing lane or a short four-lane section is added to a rural two-lane, two-way road to increase passing opportunities; and
- Any combination of the above improvements.
The EB Method is not applicable to the following types of improvements:
- Projects in which a new alignment is developed for a substantial proportion of the project length; and
- Intersections at which the basic number of intersection legs or type of traffic control is changed as part of a project.”
If the EB procedure is applicable for only some sites (homogeneous segments or intersections) within a project, is it appropriate to apply the EB to those sites and not others – or should EB only be used if it can be applied to all sites in a project?
As noted in HSM Volume 2, Section A.2.1 (Determine Whether the EB Method is Applicable):
“If the EB Method is applied to individual roadway segments and intersections, and some roadway segments and intersections within the project limits will not be affected by the major geometric improvement, it is acceptable to apply the EB Method to those unaffected segments and intersections.”
The intent of the above paragraph might be restated as follows: “If the EB Method is applied to individual sites and some sites within the project limits will not undergo a major geometric improvement, it is acceptable to apply the EB Method to these sites. In other words, the site-specific EB Method can be applied to some sites within the project limits and not applied to other sites.”
Is it appropriate to compare results for alternative designs using EB to alternatives not using EB?
Section B.2.1 in Appendix B to Part C (published in the 2014 Supplement) provides the following guidance related to this question:
“If alternative improvements are being evaluated for a given project and the EB Method is being considered, then the EB Method will need to be consistently applied to all alternatives being evaluated. If the EB Method cannot be consistently applied to all alternatives, then it should not be used for any alternatives (i.e., the predictive method should be used without EB adjustment). In this case, it is appropriate to use the predictive method without EB adjustments. This approach recognizes that there is typically a small difference in the results obtained from the predictive method when it is used with and without the EB Method. If the EB Method is not applied consistently, such differences will likely introduce a small bias in the comparison of expected crash frequency among alternatives.”
What is the difference between observed, predicted, and expected average crash frequency?
The HSM predictive method can calculate both the predicted crash frequency and the expected crash frequency under different scenarios.
The
predicted average crash frequency of an individual site is the crash frequency calculated with the SPF and CMFs based on the geometric design, traffic control features, and traffic volume of the site. This method will be used when estimating the crash frequency for a past or future year or when the observed crash frequency is not available.
The
observed crash frequency refers to the historical crash data observed/reported at the site during the period of analysis.
When the observed crash frequency is available, the expected crash frequency can be calculated.
The
expected crash frequency uses the EB method to combine the observed crash frequency with the predicted average crash frequency to produce a more statistically reliable measure. A weighted factor is applied to both estimates; this reflects the statistical reliability of the SPF. The expected crash frequency is the long-term average crash frequency that would be expected from the specific site and is more statistically reliable as compared with the predicted crash frequency.
Is it appropriate to use CMFs from outside HSM Part C with the Part C models?
HSM Part C, Section C.7 (Methods for Estimating the Safety Effectiveness of a Proposed Project) describes four methods for estimating the change in expected crash frequency of a proposed project or design alternative, in order of predictive reliability:
“The Part C predictive method provides a structured methodology to estimate the expected average crash frequency where geometric design and traffic control features are specified. There are four methods for estimating the change in expected average crash frequency of a proposed project or project design alternative (i.e., the effectiveness of the proposed changes in terms of crash reduction). As seen in the methodologies below, CMFs from outside HSM Part C can be used in coordination with Part C models if the appropriate information cannot be obtained exclusively in Part C. In order of predictive reliability (high to low) these are:
- Method 1—Apply the Part C predictive method to estimate the expected average crash frequency of both the existing and proposed conditions.
- Method 2—Apply the Part C predictive method to estimate the expected average crash frequency of the existing condition and apply an appropriate project CMF from Part D (i.e., a CMF that represents a project which changes the character of a site) to estimate the safety performance of the proposed condition.
- Method 3—If the Part C predictive method is not available, but a Safety Performance Function (SPF) applicable to the existing roadway condition is available (i.e., an SPF developed for a facility type that is not included in Part C of the HSM), use that SPF to estimate the expected average crash frequency of the existing condition. Apply an appropriate project CMF from Part D to estimate the expected average crash frequency of the proposed condition. A locally-derived project CMF can also be used in Method 3.
- Method 4—Use observed crash frequency to estimate the expected average crash frequency of the existing condition and apply an appropriate project CMF from Part D to the estimated expected average crash frequency of the existing condition to obtain the estimated expected average crash frequency for the proposed condition.
In all four of the above methods, the difference in estimated expected average crash frequency between the existing and proposed conditions/projects is used as the project effectiveness estimate.”
Situation A: The existing intersection is all-way stop controlled and the analyst is interested in making a change to this intersection (e.g., add a lane) while retaining the all-way stop control operation. For this situation, Methods 1 and 2 are not available because there are no Part C models for all-way stop controlled intersections. If an SPF for all-way stop control has been developed for the region in question and a CMF for the proposed change is available, then Method 3 can be used. If no SPF is available but a CMF for the proposed change is available, then Method 4 can be used.
Situation B: The existing intersection has two-way stop control and the analyst is interested in changing to all-way stop control operation. For this situation, Method 1 is not available because there are no Part C models for all-way stop controlled intersections. Method 2 is available because Part C does include a model for two-way stop control and Part D includes a CMF for the conversion from two-way stop control to all-way stop control. Note that the CMF in Part D for converting minor-road stop control to all-way stop control (Table 14- 5, p. 14-12) only applies when MUTCD warrants are met.
A caveat: In Situation B, the analyst should not use the Part C model and Part D CMF to develop an equivalent Part C AWSC predictive method. The inputs to the Part C TWSC predictive method are based on (and calibrated to) data from TWSC intersections. A true AWSC predictive method would be based on data from AWSC intersections.
How should I best determine whether a roadway segment or intersection is rural or urban?
The predictive models were developed using data from the states (typically via the Highway Safety Information System (HSIS), or the Highway Performance Monitoring System (HPMS)) wherein the definition of urban and rural are likely to follow the definitions offered in the HSM. In the HSM, the definitions of ‘urban’ and ‘rural’ areas are based on Federal Highway Administration (FHWA) guidelines which classify ‘urban’ areas as places inside urban boundaries where the population is greater than 5,000 persons. ‘Rural’ areas are defined as places outside urban areas which have a population of less than 5,000 persons. The HSM uses the term ‘suburban’ to refer to outlying portions of an urban area; the predictive method does not distinguish between urban and suburban portions of a developed area.
The HSM allows for user discretion and models should be calibrated to adjust for local conditions to account for differences in urban / rural definitions.
What if my site is not exactly like a site in the HSM?
The site under investigation should follow strictly with the facility types described in HSM because any minor differences will significantly affect the calculated crash frequency.
Predictive Method for Rural Two-lane, Two-way Roads (Chapter 10)
Does Chapter 10 - Predictive Method for Rural Two-Lane, Two-Way Roads apply to unpaved roads?
No data from unpaved roads were used to develop any of the HSM predictive methods. So, Part C is not intended for evaluation of unpaved roads.
Where can I get additional information about how to calculate the roadside hazard rating?
Refer to HSM Appendix 13.A (p. 13-59) for additional roadside hazard rating information.
Specialized Procedures Common to All Part C Chapters (Appendix A)
How should default values in the HSM be handled?
The HSM provides default values for items such as costs of injuries, severity distributions, and percentage of animal crashes (refer to Section A.1.3 of the Appendix to HSM Part C for guidance on developing default values). These defaults are the most appropriate values for inclusion in a manual to be used by a variety of agencies and organizations across the country, but if a user has reliable local values, the local values should be used instead of defaults. This will provide results more applicable to the specific situation for which the HSM is being used.
Should separate calibration factors be developed for each crash type and severity level?
Yes, whenever feasible, calibration factors should be developed for all SPFs available (unless specifically stated otherwise in the Part C chapter of interest). There is no problem with calculating separate calibration factors for each crash type and severity level, as long as the agency has enough observed crashes in their calibration data set to support that type of breakdown. As noted in section A.1.1.2 of the Appendix to HSM Part C, the desirable minimum sample size for the calibration data set is 30 to 50 sites, and the entire group of calibration sites should represent a total of at least 100 crashes per year. So, if an agency wishes to derive separate calibration factors by crash type and severity level, then each of those factors would require a minimum of 30 to 50 sites and 100 observed crashes per year.
Should separate calibration factors be developed for different AADT ranges?
Studies have found that greater accuracy in predictive crash frequencies was achieved when calibration was done for groupings of AADT volumes.
The report
User’s Guide to Develop Highway Safety Manual Safety Performance Function Calibration Factors provides a step-by-step procedure for calculating local calibration factors (12). In this Guide, Section 6 and Appendix D provide a simple procedure using Excel Pivot Tables to assess the differences between different AADT groupings. The Guide recommends to consider developing a calibration AADT-based function during the calibration process.
Should calibration factors be developed for portions of a highway network?
Studies have indicated that there are significant differences in calibration factors due to many variables such as climate, terrain, segment length, roadside design, etc.
The report
User’s Guide to Develop Highway Safety Manual Safety Performance Function Calibration Factors provides a step-by-step procedure for calculating the local calibration factors (12). The Guide recommends that the agency consider key variables and if data are available, assess the need for separate calibration factors, or preferably a calibration function, as discussed in Appendix D.
How often should calibration factors be updated?
Calibration factors should be developed for the year or years as close to the application as possible. In other words, if a project planning or design is carried out in 2018, it would be best to use calibration factor/s developed using data as recent as 2016 or 2017.
What if I do not have a local calibration factor for the HSM Part C SPFs? What is the effect on the result?
The user can let the calibration factor be the default value of 1.00 if no local calibration factor is available. However, the SPFs were developed based on crash data extracted from several states, and the general level of crash frequencies may vary substantially from one jurisdiction to another for a variety of reasons including climate, driver populations, animal populations, crash reporting thresholds, and other variables. The local calibration factor was developed to account for the differences on safety performance among different jurisdictions. The results calculated by the HSM Part C predictive models can be used as a relative comparison if no local calibration factor is available. See HSM Appendix A to Part C for details on calculating calibration factors.
The report
User’s Guide to Develop Highway Safety Manual Safety Performance Function Calibration Factors may also be consulted (4). This Guide provides a step-by-step procedure for calculating the SPF local calibration factors
Can calibration factors from
SafetyAnalyst be used in HSM calculations?
Calibration factors from
SafetyAnalyst cannot be used in applying the HSM Part C procedures, and calibration factors from HSM Part C procedures cannot be used in applying
SafetyAnalyst, because calibration is performed differently in
SafetyAnalyst and HSM Part C. In
SafetyAnalyst, the calibration procedure addresses the calibration of SPFs by themselves. In the HSM Part C procedures, the entire predictive method, including both SPFs and crash modification factors (CMFs), is calibrated.
How large should a site sample size be for calibration?
HSM Appendix A to Part C, section A.1.1.2, notes that “For each facility type, the desirable minimum sample size for the calibration data set is 30 to 50 sites, with each site long enough to adequately represent physical and safety conditions for the facility.” Where practical, calibration sites should be randomly selected from a larger set of candidate sites. “Following site selection, the entire group of calibration sites should represent a total of at least 100 crashes per year.”
Additionally, the report
User’s Guide to Develop Highway Safety Manual Safety Performance Function Calibration Factors provides a step-by-step procedure for calculating the local calibration factors (12). In this Guide, Section 6.2 presents a procedure to determine the sample size that is more rigorous than that provided in HSM Section A.1.1.2. The procedure in the Guide considers the standard deviation desired for the estimate of the calibration factor. In this procedure, the sample size is based on the annual observed crash frequency and the unadjusted predicted crash frequency for a sample of sites randomly selected to represent a given facility type.
What should be done in the case of insufficient data for a certain facility type? can a valid calibration factor still be determined?
In practice, some agencies have found that – for certain facility types – all sites combined do not total more than the minimum 100 crashes per year and/or there are fewer than the minimum 30 sites (e.g., intersections) in the available database. In that case, it is recommended that all available data be used to determine the calibration factor.
Is it important to replace the HSM default crash severity and collision type distribution tables by jurisdiction-specific data?
Yes, HSM tables should be replaced by jurisdiction-specific data whenever possible. Observed crashes on all sites for a given facility type within the jurisdiction network should be included in the distribution tables. In some instances, there may be significant variations in road characteristics and climate, resulting in significantly different regional calibration factors. Such differences in calibration factors may require the development of regional crash severity and collision type distributions to account for the differences, producing more accurate results.
Can data assembled for the development of calibration factors be used for a recalibration effort?
Definitely. It is very important to preserve the data collected for future calibration efforts. Traffic and geometric elements remain the same unless a project was carried out, such as addition of turn lanes, signalization of a 2-way STOP intersection, etc. The current crash and exposure (traffic volumes) data will be entered to the database linking to the unchanged roadway elements.
Can data assembled for the development of calibration factors be used for development of jurisdiction-specific SFPs?
Yes, the same data elements are needed for SPF development.
How should an agency prioritize data collection efforts when undertaking the calibration of several Part C predictive models?
The report
User’s Guide to Develop Highway Safety Manual Safety Performance Function Calibration Factors provides a step-by-step procedure for calculating the local calibration factors (12). This Guide presents prioritization criteria that would assist an agency identify their priorities in relation to the road improvement and expansion program, and availability and interoperability of traffic, geometric and crash data.
When should an agency develop jurisdiction-specific SPFs?
The
Safety Performance Function Decision Guide by Srinivasan et al. (18) provides comprehensive guidance to assist in the decision process.
How much is gained in accuracy by using an agency-developed SPF rather than a calibrated SPF?
The SPFs presented in HSM Part C, when calibrated to local conditions, should provide acceptable levels of accuracy for application of HSM Part C procedures. The HSM does not require that each agency develop their own SPFs, because a requirement for SPF development might become an impediment to highway agency implementation of the HSM. However, agency-developed SPFs should be even more accurate than calibrated SPFs from the HSM. As long as local SPFs are developed with properly applied statistical techniques, it is reasonable that statistical models developed with local data should be more accurate than models developed with data from elsewhere and calibrated to local conditions. Guidance for the development of SPFs with highway agency data has been provided in HSM Part C Appendix A.1.2, and more detailed guidance is being developed. Additional guidance is provided in the report by Srinivasan and Bauer (19). In summary, use of SPFs presented in HSM Part C and calibrated to local conditions is acceptable; use of SPFs developed from an agency’s own data using proper statistical techniques is also acceptable.
There can be no general quantitative answer as to how much better an agency-developed SPF will be in comparison to a calibrated SPF. This will vary on a case-by-case basis.
How should the usefulness of agency-developed SPFs be assessed to determine whether they are preferable to calibrated SPFs?
In comparing SPFs, those models with better goodness-of-fit measures and smaller overdispersion parameters are generally preferable. However, it should be kept in mind that the goodness-of-fit measure and overdispersion parameter for any model is determined with respect to the data set used to develop that model. Thus, the goodness-of-fit and overdispersion parameters for calibrated SPFs from HSM Part C and agency-developed SPFs are not necessarily comparable. The best method for comparing calibrated SPFs from HSM Part C to agency-developed SPFs would be apply both models to sites from the road network of the highway agency of interest and compare the observed and predicted crash frequencies. Such comparisons should be made using sites other than the sites used in fitting the agency-developed SPF and sites used in calibrating the HSM SPF. A portion of the available data set can be held aside from model development and calibration for this purpose.
What data quality is needed for agency datasets used to develop SPFs?
Naturally, any SPF will be only as good as the data from which the SPF is developed. And, unfortunately, most existing safety data bases are far from perfect, but agencies have no choice but to work with the data they have available. The following guidelines describe the desirable characteristics of data bases for SPF development.
The development of SPFs from data for a specific highway agency requires data on roadway segment or intersection characteristics and data on crash history that can be linked together by location. This linkage is necessary so that each crash can be attributed to a particular roadway segment or intersection. Appendix A of Part C offers the following guidance for determining crash location:
- “All crashes that occur within the curbline limits of an intersection are assigned to that intersection. Crashes that occur outside the curbline limits of an intersection are assigned to either the roadway segment on which they occur or an intersection, depending on their characteristics. Crashes that are classified on the crash report as intersection-related or have characteristics consistent with an intersection-related crash are assigned to the intersection to which they are related; such crashes would include rear-end collisions related to queues on an intersection approach.
- Crashes that occur between intersections and are not related to an intersection, such as collisions related to turning maneuvers at driveways, are assigned to the roadway segment on which they occur.
In some jurisdictions, crash reports include a field that allows the reporting officer to designate the crash as intersection-related. When this field is available on the crash reports, crashes should be assigned to the intersection or the segment based on the way the officer marked the field on the report. In jurisdictions where there is not a field on the crash report that allows the officer to designate crashes as intersection-related, the characteristics of the crash may be considered to make a judgment as to whether the crash should be assigned to the intersection or the segment. Other fields on the report, such as collision type, number of vehicles involved, contributing circumstances, weather condition, pavement condition, traffic control malfunction, and sequence of events can provide helpful information in making this determination.” (Appendix A, HSM)
Available data bases for roadway segment or intersection characteristics should contain all the data needed to identify sites of the specific type under consideration (e.g., rural undivided two-lane, two-way roadway segments or three-leg unsignalized intersections with STOP-control on the minor road), as well as traffic volume and any other variables to be considered as independent variables. In addition to the crash location guidelines presented above, crash data bases should include, at a minimum, crash severity and crash type.
The database needs to include all the attributes identified as “base conditions” in the predictive method. The SPFs must be calibrated to respect all base values specified in the appropriate Part C chapter.
If a highway agency develops agency-specific SPFs with its own data, and the agency-developed SPFs have a different shape from those found in HSM Part C, is there something wrong? Which SPF should be used?
Research has not established any single best shape for particular SPFs. The functional forms used for SPFs in HSM Part C will accommodate a variety of shapes depending on the values of the coefficients in the fitted model. Thus, if an agency-developed SPF that was developed with properly applied statistical techniques appears to have a different shape than the calibrated SPF from HSM Part C, the agency-developed SPF may still be preferable to the calibrated SPF.
Why do the shapes of SPF curves for a given facility type often vary markedly from one agency to another or from one region to another within a state? Are such variations real or are they artifacts of sample size or data quality issues?
Not enough is known about SPFs to provide a general answer to this question. But, there is no doubt that researchers developing SPFs have encountered variations of this kind. Research is needed on this issue.
Predictive Method for Freeways (Chapter 18)
How can I assess the safety tradeoffs between median barrier and flush median without sufficient clear zone?
The freeway model does not include a CMF to describe roadsides with stationary hazards present in the clear zone (e.g., non-traversable slope, fence line, utility poles, etc.). The researchers did not find enough segments with these hazards to calibrate this type of CMF. So, the presence of barrier when a stationary hazard is present is a "given" for the design and the analysis; that is, the existing barrier CMF cannot be used to evaluate the "with/without barrier" alternatives.
If an agency has a traversable median (no stationary hazards) and they desire to examine the "with/without median barrier" alternatives, then they can do this using the median barrier CMF. In this case, the presence of the barrier will show an increase in crash frequency which is logical since the median barrier reduces the clear zone width by about 50 percent (assuming the barrier is centered in the median). However, it should also show a reduction in the proportion of severe crashes which is often the desired result when the goal is to reduce severe crashes.
How was ramp metering considered in the development of the freeway crash prediction models?
The final report for
NCHRP Project 17-45 (20) (p. 37) cites three studies that examined the effect of ramp meter presence on freeway safety. The findings from each study indicate that ramp meter presence does influence safety on the sections of freeway along which the entrance ramps are metered. This information is the basis for the identified limitation on Page 18-56. The method was not developed to evaluate freeway sections that are influenced by ramp meters.
Desirably, at some future date, the analyst will have access to a method in the HSM that explicitly addresses freeway sections with adjacent and upstream ramp meters. The method would address the influence of ramp meter design, operation, and proximity on freeway segment and speed-change (s-c) lane safety. Until that date, a case could be made for the use of the existing Chapter 18 method to evaluate freeway sections in the vicinity of ramp meters. To do this, the analyst will need to develop a unique set of calibration factors for the Chapter 18 method using data from freeway segments (and s-c lanes) where all nearby entrance ramps are metered. The analyst proceeding in this manner must recognize that he/she is extending the method beyond the conditions for which it was developed and use additional care when reviewing the results obtained. [note: By implication, a separate set of calibration factors would likely be needed for the evaluation of freeway segments (and s-c lanes) where there are no nearby metered ramps.]
The
NCHRP 17-45 Final Report (20) (p. 20) cites a study that indicates ramp segment crash frequency is significantly increased by the presence of ramp meters, so the comments above also apply to the local calibration of the ramp segment predictive method in Chapter 19.
Does the freeway crash predictive method apply beyond the last interchange when a freeway transitions into a grade separated facility, and if so where does it end?
The predictive method for freeways would apply beyond the last interchange. Regarding how far past the last interchange, one option is to use the freeway predictive method up to the at-grade intersection area of influence. A second option would be to establish some sort of threshold distance from the at-grade intersection (e.g., 0.5 mile) to account for the much different traffic patterns associated with an approach to an intersection versus the mainline freeway/interchanges.
The option selected would greatly depend on the traffic control at the at-grade intersection, posted speed changes (if any) approaching the intersection, and advance warning signs (e.g., “freeway ends in X miles”). For example, one could argue that if the intersection traffic control is stop-control on the minor road, then perhaps using the freeway method close to the intersection influence area might be appropriate. In contrast, for a signalized intersection the freeway predictive method should not be applied nearly that close to the intersection. Engineering judgment is thus required, using knowledge of the intersection traffic control, posted speeds, traffic patterns at the intersection (e.g., queue lengths during red signal periods at signalized intersection).
When identifying sites to be used for local calibration, it is advisable to find sites that are similar to those used to develop the model. This approach will yield the most reliable local calibration factors. In this regard, the calibration sites should be a conservatively long distance from the at-grade intersection (say, > 0.5 mile).
Why does lighting not have any CMF in freeway and ramp models? Is the effect insignificant or has there not been data to support model development for this?
The data used in Project 17‐45 did not indicate whether lighting was present along a segment. It did indicate whether lighting was present at an intersection but there were not sufficient project resources to confirm the accuracy of this data element using a video log.
Should the same criteria that are used to break the freeway segments into homogenous segments also be used to break speed‐change lanes to shorter speed‐change segments?
A speed‐change lane can be separated into two or more segments if dictated by the segmentation rules. The freeway method does not specifically describe how to evaluate “partial speed‐change lane” segments because almost all speed‐change lanes are relatively short and do not need to be broken into segments.
To use the method for partial speed‐change lane segments, the length used in the calculation of the SPF and the over‐dispersion factor (K) would use the “partial speed‐change lane length” instead of the total speed‐change lane length. In contrast, the ramp‐exit CMF and the ramp‐entrance CMF would always use the total speed‐change lane length.
It appears from the examples that the CMF for weaving decreases with increasing traffic volumes. This seems counter intuitive.
The Lane Change CMF decreases in value with an increase in ramp volume. This trend was noted by the researchers and discussed in the Project 17-45 Final Report (20) (p. 151). The following text is excerpted from the report.
“The calibration coefficient associated with the ramp AADT term in Equations 103 and 104 is negative which is counterintuitive at first glance. It indicates that the lane change CMF is larger for segments associated with lower volume ramps. This trend may be explained by the fact that high-volume ramp flows tend to dominate the traffic stream such that a large portion of the traffic stream is changing lanes and all drivers are more aware of these maneuvers. Regardless, the entering ramp volumes are also included in the segment AADT volume and the coefficient associated with the segment AADT variable in the SPF is positive and relatively large. As a result, when all relevant SPFs and CMFs are combined, the predicted average crash frequency for a freeway segment increases with an increase in the AADT volume of nearby ramps. This trend is logical and intuitive.”
As indicated near the end of the text, the analyst should be careful to change the freeway segment volume by the same amount as the change in ramp volume to ensure volume balance on the freeway (and to get the correct results from the model).
Predictive Method for Ramps (Chapter 19)
Can the Predictive Method be applied to ramps providing two-way travel?
The method can certainly be applied if the two directions of traffic are separated by a physical median barrier. If there is no separation by a physical median barrier, the method can be applied with the understanding that it does not account for (i.e., predict the frequency of) any opposite direction crashes that may occur.
When identifying sites to be used for local calibration, it is advisable to find sites that are similar to those used to develop the model. This approach will yield the most reliable local calibration factors.
What is the difference between a connector ramp and entrance or exit ramp at service interchange?
The connector ramps that are addressed by the ramp method include: outer connection, loop or semi-direct connection, and direct connection. The key difference between connector and non-connector ramps is the speed at the terminal between the ramp and the crossroad.
Non-connector ramps (i.e., entrance ramps and exit ramps) are found at service interchanges. They have some type of traffic control for one or more ramp movements at the intersection of the ramp and the crossroad (typically requiring a stop or yield).
Connector ramps do not have traffic control at the intersection of the ramp and the crossroad (i.e., the ramp merges with the crossroad using a speed-change lane design). Connector ramps at service interchanges are assumed to have a "low speed" merge with the crossroad. Connector ramps at system interchanges are assumed to have a "high speed" merge with the crossroad.
These low and high-speed distinctions are reflected in the ramp method where it recommends using the entrance ramp (or exit ramp) predictive model for connector ramps at service interchanges. And, it recommends using the collector-distributor (CD)-road model for connector ramps at system interchanges. These distinctions are also reflected in the speed-prediction model that is part of the ramp method.
For ramp terminals, the CMF for a channelization of a right turn lane is greater than 1.0. Why is this the case?
A channelized right-turn is defined as a right turn that has a triangular channelizing island on the left side of the driver at the intersection. As discussed in the Final Report for Project 17-45 (20), right-turn channelization does not provide an expected safety benefit. This finding is rationalized that the channelization puts the right-turning driver in a suboptimal position for judging the adequacy of an entry gap on the crossroad.
Crash Modification Factors (Part D)
What is a CMF?
A Crash Modification Factor (CMF) is a value that quantifies the expected change in crash frequency at a site as a result of implementing a specific countermeasure. Countermeasures can also be called “treatments” or “safety treatments”. A CMF can estimate the expected change in crash frequency for total crashes, a particular crash type, or a particular severity. A CMF is expressed as:

A CMF can also be a crash modification function, which is a formula used to compute the CMF for a specific site based on its characteristics. Crash modification functions are useful because it is not always reasonable to assume that a treatment will have the same safety effect at sites with different characteristics (e.g., safety benefits may be greater for sites with higher traffic volumes). A crash modification function allows the CMF to change over the range of a variable or combination of variables.
Who uses CMFs and how are they used?
CMFs are used by several groups of transportation professionals for various reasons. The primary user groups include highway safety engineers, traffic engineers, highway designers, transportation planners, transportation researchers, and managers and administrators. As tools in the safety evaluation process, CMFs can be used to:
- Capture the greatest safety gain with limited funds
- Compare safety consequences among various alternatives and locations
- Identify cost-effective strategies and locations
- Check reasonableness of evaluations (i.e., compare new analyses with existing CMFs)
- Check validity of assumptions in cost-benefit analyses
Examples:
- A traffic engineer could use CMFs to evaluate the relative cost-effectiveness of several countermeasures for enhancing signal visibility. Countermeasures included increasing lens size, installing signal backplates, and installing dual red indicators in each signal head.
- A highway designer could use CMFs to compare the cost and safety consequences between paved and unpaved shoulders.
- A transportation planner could use CMFs to compare the long-term safety impacts of a series of roundabouts as opposed to a series of signalized and unsignalized intersections.
What is meant by the “base condition”?
The values of CMFs in the
Highway Safety Manual (HSM) are determined for a specified set of base conditions. These base conditions represent the site conditions before implementation of a treatment. This allows comparison of treatment options against a specified reference condition. For example, CMF values for the effect of lane width changes are determined in comparison to a base condition of 12-ft. lane width. Under the base conditions (i.e., with no change in the conditions), the value of a CMF is 1.00.
What is the numerical value of a CMF
A countermeasure with a CMF greater than 1.0 is expected to increase crashes at the site following installation, while a countermeasure with a CMF less than 1.0 is expected to decrease crashes. A countermeasure with a CMF equal to 1.0 is not expected to have an effect on crash frequency.
How do I apply a CMF?
A CMF is a multiplicative factor applied to an estimate of the expected crash frequency. The estimate can represent a particular crash type or particular crash severity as specified in the HSM or in the underlying study associated with the treatment. There are examples at the end of this section that show sample calculations.
In the HSM, what does the CMF standard error mean?
The standard error (SE) indicates the anticipated variation in the results of the CMF. A smaller SE indicates more certainty in the results. The CMFs with a SE less than 0.1 are identified in the HSM through the use of bold text. Table 1 summarizes the formatting used in the HSM to indicate the SE of a CMF. The SE is used to calculate a confidence interval for the CMF value. The equation for the 95th percentile confidence interval is CMF ± (1.96*SE). In the HSM, this equation is rounded to CMF ± (2*SE). The examples at the end of this document demonstrate application of the confidence interval.
Table 1: Formatting used in the HSM to indicate the Standard Error of a CMF

How do I select a Treatment/CMF?
When selecting treatments and CMFs, it is important to make sure the treatment is applicable to the site of interest. For example, the same countermeasure used on different road types may have different effects. Therefore, applying a CMF at a location that does not correspond to the setting (i.e. base condition) identified in the study may provide an erroneous estimate of the expected change in crash frequency. This could result in infrastructure investments that may not be as beneficial as expected.
When determining an appropriate CMF, consider the following factors for applicability in the context of specific projects: area type (rural vs. urban), study location (differences in driver characteristics), traffic volumes, speed limit, and traffic control. Refer to the CMF Clearinghouse research studies or HSM Part D for additional details of factors considered in the development of CMFs.
Can a CMF have a different effect on different crash types?
A CMF may have a different effect on different crash types or severities. As an example, consider Table 2 which presents CMFs from Table 14-7 of the HSM for installing a traffic signal at a rural stop-controlled intersection. Notice the CMF for all crash types and all severities is equal to 0.56 plus or minus a standard error of 0.03, but for right-angle crashes for all severities, the CMF is equal to 0.23 plus or minus a standard error of 0.02. In some cases, a treatment may increase certain crash types (i.e., CMF > 1.0) while reducing others (i.e., CMF < 1.0). For example, notice that though the installation of a traffic signal is expected to reduce angle and turning crashes, it is actually expected to increase rear-end crashes, though the net benefit is an expected reduction in the overall crashes. The potential for differential crash effects underscores the importance of properly applying CMFs—only apply CMFs to the applicable crash types and severities.
Table 2: from HSM Table 14-7 - Potential Crash Effect of Converting from Stop to Signal Control
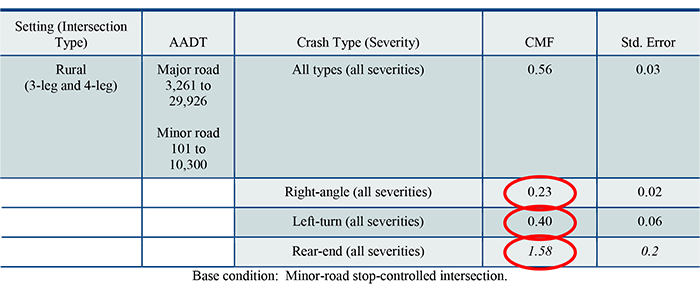
How do I calculate the effect of multiple treatments at one site?
If multiple countermeasures are implemented at one location, then common practice is to multiply the CMFs to estimate the combined effect of the countermeasures. The likelihood of overestimation increases with the number of CMFs that are multiplied. Therefore, much caution and engineering judgment should be exercised when estimating the combined effect of more than three countermeasures at a given location. The CMFs being considered should all be applicable to the same conditions and location and be consistent with the conditions under which the CMF was developed. Conditions are defined by: setting (road type or intersection type), crash type (severity, manner of collision), time period (day/night), and traffic volume (if specified).
It is important to consider that although implementing several countermeasures might be more effective than just one, it is unlikely the full effect of each countermeasure would be realized when they are implemented concurrently, particularly if the countermeasures are targeting the same crash type. For example, shoulder rumble strips and enhanced edgeline retroreflectivity would both target roadway departure crashes, so the CMFs for these treatments would be highly related.
In some cases, countermeasures may be implemented at the same location to target different crash types. For example, the installation of a pedestrian signal would be relatively independent of the installation of a left turn phase at an intersection, since the one addresses pedestrian-vehicle crashes while the other addresses left-turn opposite-direction crashes. Likewise, the conversion of a left turn phase from permissive to protected along with the installation of an exclusive right turn lane would be fairly independent in that they target different crash types.
Unless the countermeasures act completely independently for the same crash types, multiplying several CMFs is likely to overestimate the combined effect.
It is good practice to conduct an individual CMF sensitivity analysis for each countermeasure and retain the most influential CMF value for each specific target crash type so that the safety performance is not over estimated.
More information on combining multiple CMFs can be found here (http://www.cmfclearinghouse.org/collateral/Combining_Multiple_CMFs_Final.pdf).
What is the difference between the CMFs in Part D and Part C of the HSM?
Part D includes all CMFs which have been assessed through a literature review and inclusion process, including measures of their reliability and stability. These CMFs are applicable to a broad range of roadway segment and intersection facility types, not just those facility types addressed in the Part C predictive methods. The CMFs in Part C are those which have been formally integrated into a particular safety-prediction methodology.
I've seen the term "Accident Modification Factor" (AMF) before. Is that different than a Crash Modification Factor?
Aside from the name, Accident Modification Factor is the same thing as Crash Modification Factor (i.e., AMF of 0.80 = CMF of 0.80). Although the CMF Clearinghouse does not use the term "AMF", there are instances of its use in various areas of the safety field. For example, early drafts of the Highway Safety Manual used the term "AMF", but the decision was made to change the terminology to "CMF" for the final publication.
How do you determine statistical significance using the standard error?
A CMF is determined to be statistically significant if the specified confidence interval of the CMF does not include 1.0, since a value of 1.0 indicates no effect from the countermeasure. For a given CMF and standard error, the confidence interval will depend on the significance level that is used. The two most common significance levels are 0.05 (corresponds to 95% confidence interval) and 0.10 (corresponds to 90% confidence interval).
For the 95% confidence level, the confidence interval is equal to the CMF ± 1.96 * (standard error).
For the 90% confidence level, the confidence interval is equal to the CMF ± 1.64 * (standard error).
Example:
The CMF for countermeasure A is 0.80 with a standard error of 0.15. The lower and upper limits of the 95% confidence interval are the following:
Lower limit: 0.80 – 1.96*0.15 = 0.80 – 0.294 = 0.506
Upper limit: 0.80 + 1.96*0.15 = 0.80 + 0.294 = 1.094
Since the 95% confidence interval (0.506, 1.094) includes 1.0, we cannot be sure that this CMF is statistically different from 1.0 (at the significance level 0.05, i.e., confidence level 0.95)
On the other hand, if the same CMF had a standard error of 0.09, then the lower and upper limits of the 95% confidence interval will be the following:
Lower limit: 0.80 – 1.96*0.09 = 0.80 – 0.1764 = 0.6236
Upper limit: 0.80 + 1.96*0.09 = 0.80 + 0.1764 = 0.9764
Since the 95% confidence interval (0.6236, 0.9764) does not include 1.0, this CMF is statistically different from 1.0 (at the significance level 0.05, i.e., confidence level 0.95).
How can CMFs be applied in the Roadway Safety Management Process?
CMFs can be applied in the roadway safety management process to help select countermeasures and prioritize projects through an economic evaluation (e.g., benefit-cost analysis). The roadway safety management process is a six-step process as shown in Figure 1 and outlined in the HSM.
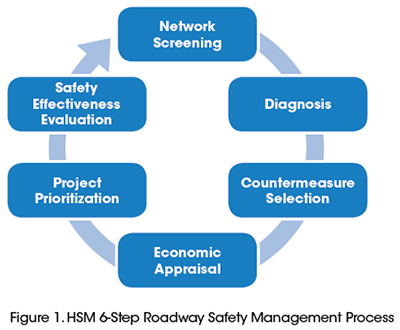
The Highway Safety Improvement Program (HSIP) Manual [3] identifies this process as planning, implementation, and evaluation, where planning covers problem identification, countermeasure identification, and project prioritization. In either case, CMFs can play a role in the countermeasure selection and project prioritization components of the roadway safety management process. While not directly applicable to the application of CMFs, one can develop new CMFs in the safety effectiveness evaluation component of the process.
Transportation professionals frequently use CMF values to identify countermeasures with the greatest safety benefit for a particular crash type or location. The application of CMFs also helps to prioritize potential treatments and provides decision-makers with the information needed to identify cost-effective strategies.
What are potential challenges to applying CMFs in the safety management process (and opportunities to overcome these challenges)?
Potential challenges may arise when applying CMFs in the roadway safety management process. Many are directly related to limitations in the progress of CMF research, while others apply to the lack of understanding of CMFs. Despite decades of advancement in CMF research, there are still knowledge gaps that present obstacles for practitioners seeking to apply CMFs in the roadway safety management process.
The Introduction to Crash Modification Factors [7] provides general guidance related to the application of CMFs. The following are general challenges associated with the application of CMFs and opportunities to overcome challenges. The discussion includes specific concerns and lessons learned based on actual experiences with the application of CMFs in roadway safety management efforts.
Availability of CMFs
A notable potential challenge is the availability of CMFs for specific countermeasures. The
CMF Clearinghouse contains over 5,800 star-rated CMFs for a wide range of safety countermeasures under a variety of conditions. However, CMFs are still lacking for a large number of treatments, especially combination treatments and those that are innovative and experimental in nature. Furthermore, CMFs may not be available for certain crash types and severities.
Applicability of CMFs
CMFs are developed based on a sample of sites with specific conditions. While a CMF may be available for a given treatment, it may not be appropriate for the scenario under consideration. For example, there may be significant differences between the characteristics of a proposed treatment site and the sites used to develop the CMF (e.g., different area type, number of lanes, or traffic volume). The
CMF Clearinghouse and HSM provide information to help users identify the applicability of CMFs.
A related challenge may be that multiple CMFs exist for the same treatment and conditions. This is particularly challenging when multiple studies have estimated CMFs for the same countermeasure and combination of crash type and severity level, but yielded dissimilar results.
If the CMFs also apply to the same roadway characteristics, then the selection can become even more difficult. A star quality rating—which appraises the overall perceived reliability of a CMF using a range of one to five stars—is provided by the CMF Clearinghouse and may be helpful in these circumstances to identify the most suitable CMF. However, the ratings of the different CMFs may be similar as well. If the various CMFs have a fairly small range of values, then this situation may not be of great concern. Yet, it is possible for the CMFs to vary significantly and even have contradictory expected outcomes (i.e., some CMFs greater than 1.0 and others less than 1.0). In such cases, this potential situation would be highly challenging to overcome.
Insufficient Expertise
A specific challenge could be that there is insufficient expertise within an agency to apply CMFs. While CMFs are not a new tool, they have only recently gained popularity among safety professionals. There are a number of opportunities to apply CMFs in aspects of transportation engineering (e.g., roadway safety management process), but it may be necessary to solicit input or assistance from those who are more familiar with the selection and application of CMFs. If an agency does not have the needed expertise related to CMFs, then they can solicit outside expertise from the State Safety Engineer, FHWA Division Office, or consultants for further guidance and assistance with the selection and/or application of CMFs and interpretation of results. The
National Highway Institute also offers several courses related to the quantification of safety using CMFs, including the
Application of CMFs (#380093) and
Science of CMFs (#380094).
Maintaining Consistency in CMF Selection Within and Across Agencies
Where multiple people or agencies applying CMFs within a State, there is the potential for inconsistency with respect to the selection and application of CMFs. There is need to encourage the consistent selection and application of CMFs in the roadway safety management process within a State, particularly if the districts/divisions/regions are competing for the same pool of funding. Some State transportation agencies have addressed this by selecting or designating the CMFs appropriate for use within their State or jurisdiction. For more information, visit
http://www.cmfclearinghouse.org/stateselectedlist.cfm.(17)
Estimating Annual Crashes without Treatment
To quantify the expected safety performance for a given alternative, it is necessary to estimate the annual crashes without treatment. The applicable CMFs are then applied to the annual crashes without treatment to estimate the annual crashes with treatment. The annual crashes without treatment can be estimated using several methods, with each bringing certain strengths and weaknesses. The most basic approach is to use the
observed crash history of the site of interest (i.e., short-term or long-term average) to estimate annual crashes without treatment. This method is relatively simple but is highly susceptible to regression-to-the-mean bias (i.e., random fluctuation in crashes over time) and could overestimate or underestimate the annual crashes without treatment. Another option to estimate annual crashes without treatment is to employ SPFs, which provide the
predicted number of crashes. SPFs help to account for the random nature of crashes at a single site by incorporating data from other similar sites. The drawback to using SPFs is that, unless they are developed using local data, they may not accurately reflect local conditions and again could overestimate or underestimate the annual crashes without treatment. The HSM presents the Empirical Bayes method as yet another option, which combines both the
observed crash history of a site and the
predicted crashes from the SPF to compute the
expected crashes.
The prior discussion assumes that the crash history is available and applicable for a given site. In some cases, the crash history may not be available (e.g., new construction); in others, the crash history may not be applicable (e.g., significant changes in the alignment). For both scenarios, it may be necessary to rely on SPF predictions, but it is suggested that the SPFs be calibrated to local conditions before applying them, whenever possible. FHWA’s Introduction to Safety Performance Functions publication [10] provides general guidance related to the selection, calibration, and application of SPFs.
HSM-Related Tools
What HSM-related tools are available?
Tools available for implementing HSM Part B include:
Tools available for implementing HSM Part C predictive methods include:
Tools available for HSM Part D include:
AASHTOWare Safety Analyst
What is Safety Analyst?
AASHTOWare Safety Analyst provides a set of software tools used by state and local highway agencies for highway safety management. It incorporates state-of-the-art safety management approaches into computerized analytical tools for guiding the decision-making process to identify safety improvement needs and develop a system-wide program of site-specific improvement projects.
How is SafetyAnalyst related to the HSM?
AASHTOWare Safety Analyst is intended for planning-level application of the roadway safety management process. Safety Analyst includes procedures intended to implement the full scope of HSM Part B.
How can my agency obtain the Safety Analyst software?
The Safety Analyst software is available through AASHTOWare, and additional information can be found at the following links:
Why don’t the HSM Part C and Safety Analyst require the same input information?
HSM Part C and AASHTOWare Safety Analyst were developed for different purposes and, therefore, require different input data. The HSM Part C predictive methods were developed for application in the project development process, to quantify the safety performance of an existing facility and of proposed alternative improvements to the existing facility. For this reason, HSM Part C has extensive input data requirements; it is presumed that all of the HSM Part C input data should be available during the development or design of a particular project.
AASHTOWare Safety Analyst is intended for network-wide application and includes procedures intended to implement the full scope of HSM Part B. AASHTOWare Safety Analyst includes procedures to quantify the safety performance of an existing facility and of proposed alternative improvements to the existing facility, but these procedures are simpler and less sophisticated than the procedures used in HSM Part C. As a result, the required input data set for AASHTOWare Safety Analyst is much less extensive than for HSM Part C, including only those items that are essential for analyses and which would be reasonable to expect could be assembled for the entire highway network.
AASHTOWare Safety Analyst includes an SPF Editor module that allows users to input their own SPFs for analysis, which can enter Part C SPFs.
Why don’t HSM Part C and Safety Analyst give similar results?
Since HSM Part C and AASHTOWare Safety Analyst were developed for different purposes and use different procedures and different data sets, it is naturally possible that that they will give different answers. Network screening procedures based on HSM Part C might theoretically provide more accurate results than the AASHTOWare Safety Analyst procedures, but obtaining all of the required input data for HSM Part C for an entire highway network is likely to be a difficult challenge. Thus, AASHTOWare Safety Analyst is generally best suited to planning-level analysis of potential alternative improvements and HSM Part C is best suited to detailed analysis of potential alternative improvements as part of the project development process and design. Both AASHTOWare Safety Analyst and HSM Part C use the EB method to compensate for potential bias due to regression to the mean.
Can calibration factors from Safety Analyst be used in HSM calculations?
Calibration factors from AASHTOWare Safety Analyst cannot be used in applying the HSM Part C procedures, and calibration factors from HSM Part C procedures cannot be used in applying AASHTOWare Safety Analyst, because calibration is performed differently in AASHTOWare Safety Analyst and HSM Part C. In AASHTOWare Safety Analyst, the calibration procedure addresses the calibration of SPFs by themselves. In the HSM Part C procedures, the entire predictive method, including both SPFs and adjustment factors, is calibrated.
Interactive Highway Safety Design Model (IHSDM)
What is IHSDM?
A product of the Federal Highway Administration’s (FHWA) Office of Safety Research and Development, IHSDM is a suite of software analysis tools for evaluating safety and operational effects of geometric design decisions on highways. IHSDM is a decision-support tool that provides estimates of existing or proposed highway designs’ expected safety and operational performance, and checks designs against relevant design policy values. Results of the IHSDM support decision-making in the highway design process. Intended users include highway project managers, designers, and traffic and safety reviewers in State and local highway agencies and in engineering consulting firms.
The IHSDM currently includes six evaluation modules (Crash Prediction, Design Consistency, Intersection Review, Policy Review, Traffic Analysis, and Driver/Vehicle), as well as an Economic Analyses Tool which allows users to do economic analyses within IHSDM, using Crash Prediction Module evaluation results (i.e., crash frequencies and severities) as input. The IHSDM website (www.fhwa.dot.gov/research/tfhrc/projects/safety/comprehensive/ihsdm/) (24) summarizes the capabilities and applications of the evaluation modules and provides a library of the research reports documenting their development.
How is IHSDM related to the HSM?
The IHSDM Crash Prediction Module (CPM) is a faithful software implementation of the predictive methods documented in Part C of the HSM, which includes capabilities to evaluate rural two-lane, two-way roads (Chapter 10), rural multilane highways (Chapter 11), urban/ suburban arterials (Chapter 12) (including predictive methods for 6+ lane and 1-way arterials developed under NCHRP Project 17-58, for inclusion in the HSM2), and freeways (Chapters 18 and 19). The CPM estimates the frequency of crashes expected on a roadway based on its geometric design and traffic characteristics. The crash prediction algorithms consider the effect of a number of roadway segment and intersection variables.
IHSDM includes a CPM Calibration Utility to assist agencies in implementing the calibration procedures described in the Appendix to HSM Part C.
How can my agency obtain the IHSDM software?
The IHSDM software is available through FHWA, free of charge. Visit the IHSDM software website,
www.ihsdm.org (16) to register and download the latest release of IHSDM.
Is IHSDM Technical Support available?
Yes, FHWA provides IHSDM technical support free of charge. Contact the IHSDM Support Team at (202)-493-3407 or by e-mail at
IHSDMsupport@dot.gov.
My agency wants to calibrate HSM Part C Predictive Models. How can IHSDM assist this effort?
A Calibration Utility is available in the IHSDM Administration Tool to assist agencies in implementing the calibration procedures described in the Appendix to HSM Part C.
The Crash Prediction panel of the Administration Tool contains three sections:
- Calibration Data Sets
- Crash Distribution Data Sets
- Model Data Sets
The Calibration Data Sets interface provides a mechanism for users to enter, edit and organize the site data to be used to calculate the calibration factors for the various crash prediction models available in the IHSDM Crash Prediction Module (and, thus, in HSM Part C). In addition to containing the user-entered site data, each Calibration Data Set is also linked to a Crash Distribution Data Set and a Model Data Set.
Within the Calibration Data Set interface, the user can choose to either “Calibrate Using Site Data” or “Manually Specify a Calibration Factor” for each of 57 crash prediction models (covering rural two-lane highways, rural multilane highways, urban/suburban arterials, and freeways).
When running a Crash Prediction Module (CPM) evaluation, the user indicates which Calibration Data Set to use in that particular evaluation. The CPM then applies the appropriate calibration factors from the user-selected Calibration Data Set.
The IHSDM Tutorial, included with the IHSDM download package, includes a CPM Calibration Lesson, which provides step-by-step instructions and hands-on exercises related to the calibration process.
If an agency has developed their own SPFs, can they be entered into IHSDM?
Yes. The IHSDM Administration Tool provides a mechanism for agencies to enter their own SPFs, as long as the SPFs follow the guidelines for development of jurisdiction-specific SPFs that are acceptable for use in HSM part C (HSM, Part C, Section A.1.2, p. A-9).
The crash prediction Model Dataset default configuration (HSM Configuration) file contains parameters and configuration data that define Safety Performance Functions (SPF) and Crash Modification Factors (CMFs) to be used in the IHSDM Crash Prediction Module. The default "HSM Configuration" may be copied and modified to reflect agency specific SPFs.
Can default crash severity and crash type distribution values be updated with agency-specific values in IHSDM?
Yes. The IHSDM Administration Tool provides a mechanism for agencies to modify the crash severity and crash type distribution values.
HSM Spreadsheets
Where can I find the latest version of the HSM spreadsheet tools?
The HSM website provides users with the latest official versions of the HSM spreadsheet tools. These tools are maintained by AASHTO and can be downloaded for free under the Part C section of the Tools page (http://www.highwaysafetymanual.org/Pages/Tools.aspx). Please check back periodically to ensure that you are using the most up-to-date version for all predictive crash analyses.
Which HSM Part C methods do the HSM spreadsheets (i.e., those produced under NCHRP Project 17-38 and State agency enhanced versions) implement?
The HSM spreadsheets implement HSM Part C methods for rural 2-lane highways (Chapter 10), rural multilane highways (Chapter 11), and urban/suburban arterials (Chapter 12).
What is ISATe and which HSM Part C methods do ISATe implement?
The Enhanced Interchange Safety Analysis Tool (ISATe) is a free, macro-enabled Excel workbook primarily used for small freeway segments. Users manually enter data for each individual segment, interchange, and cross street. ISATe implements HSM Part C methods for freeways (Chapter 18) and Ramps/Interchanges (Chapter 19).
CMF Clearinghouse
What is the CMF Clearinghouse?
The Crash Modification Factors Clearinghouse houses a web-based database of CMFs along with supporting documentation to help transportation engineers identify the most appropriate countermeasure for their safety needs. Using this site at
www.cmfclearinghouse.org (17), users are able to search for existing CMFs or submit their own CMFs to be included in the clearinghouse.
What is the purpose of the CMF Clearinghouse?
The Crash Modification Factors (CMF) Clearinghouse was established to provide transportation professionals:
A regularly updated, online repository of CMFs,
A mechanism for sharing newly developed CMFs, and
Educational information on the proper application of CMFs.
The purpose of the CMF Clearinghouse is to compile all documented CMFs in a central location. The CMF Clearinghouse provides a searchable database that can be easily queried to identify CMFs to meet user's needs.
The CMF Clearinghouse will be updated on a regular basis to add recently developed and documented CMFs. New CMFs will be identified via a periodic review of published literature. In addition, the CMF Clearinghouse provides a mechanism for transportation professionals to submit documentation of new CMFs to be considered for inclusion. Educational information on CMFs includes the "About CMFs" page, which summarizes useful information in the form of answers to frequently asked questions. The "Resources" page provides additional information on related trainings and publications.
The inclusion of all CMFs in the CMF Clearinghouse also serves an educational purpose. One important lesson is that reported CMFs have varying quality and applicability to a given user’s needs.
The CMF Clearinghouse summarizes published information on each CMF, including how it was developed (e.g., study design, sample size, and source of data) and what are its statistical properties (e.g., standard error). Where available, a link is provided to the publication from which the CMF was extracted.
The CMF Clearinghouse reports this information in a standard format to enable users to make educated decisions about the most applicable CMF to their condition. To aid users in assessing the quality of the CMF presented, the CMF Clearinghouse reports a star quality rating. The star quality rating is assigned based upon the standard error of the CMF value, as well as the design, potential biases, data source, and sample size of the study that developed the CMF.
The CMF Clearinghouse also reports whether or not the CMF is included in the Highway Safety Manual. The Highway Safety Manual includes only a subset of CMFs that meet strict inclusion criteria. The CMF Clearinghouse provides the broader context of the larger population of CMFs, from which those included in the Highway Safety Manual were drawn.
The CMFs that are included in the Highway Safety Manual will typically have a higher star quality rating given the strict inclusion criteria. High quality CMFs do not exist for every countermeasure and, therefore, there are many countermeasures for which CMFs do not appear in the Highway Safety Manual. The CMF Clearinghouse includes any documented CMF; i.e., it includes CMFs that do not appear in the HSM either because they did not meet the HSM inclusion criteria or because they were documented after the Manual was completed. As a result, the Clearinghouse includes more CMFs for more countermeasures than the HSM.
Inclusion of a CMF in the CMF Clearinghouse does not constitute an endorsement of the CMF or support for its use. The burden is on the user to determine the most appropriate CMF for their analysis need. This determination should be made based upon the CMFs applicability to their condition (i.e. countermeasure being considered and conditions under which it is implemented) and the quality of the CMF.
How does the CMF Clearinghouse relate to the HSM?
The Crash Modification Factors Clearinghouse is just one of the tools and resources available to help transportation professionals make safety decisions. The first edition of the Highway Safety Manual, released in 2010, provides practitioners with the best factual information and tools to facilitate roadway design and operational decisions based on explicit consideration on their safety consequences.
The CMF Clearinghouse incorporates information relating to the HSM within its website. Users are able to view and search for CMFs included in the HSM. The CMF Clearinghouse includes all of the CMFs listed in the HSM.
That said, it should be understood that the CMF Clearinghouse only relates to the CMF portion of the HSM (Part D). The HSM also covers many other important topics for highway safety, including safety fundamentals, road safety management, and predictive methods.
What is the difference between CMFs in the HSM and CMFs in the CMF Clearinghouse?
Currently, the two main resources for CMFs are the HSM and the FHWA CMF Clearinghouse (www.cmfclearinghouse.com) (17). A significant difference between these two resources is in how the CMF values are presented. For each treatment in the HSM, one CMF is presented for a given crash type or severity based on the best available research. The CMF may be based on a single study or may represent an aggregate value based on multiple studies. The HSM provides highest quality available research-based CMFs, while the CMF Clearinghouse is a comprehensive listing of available CMFs.
The CMF Clearinghouse is a comprehensive database of all the CMFs available for a given treatment. The quality of the CMF is rated on a one to five-star basis. All of the treatments and CMFs in the HSM are in the CMF Clearinghouse. The CMF Clearinghouse is updated regularly, with new CMFs from researchers and state agencies. Many of these new CMFs are high quality but may not yet be included in the HSM list of CMFs simply due to their date of development occurring after the publication of the 2010 HSM.
What does the star quality rating mean?
The star rating indicates the quality or confidence in the results of the study producing the CMF. The star rating is based on a scale (1 to 5), where a 5 indicates the highest or best rating. The review process to determine the star rating judges the accuracy and precision as well as the general applicability of the study results. Reviewers considered five categories for each study — study design, sample size, standard error, potential bias, and data source — and judged each CMF according to its performance in each category. For more detailed information about the star quality rating, please visit the CMF Clearinghouse’s
page on the topic.
How is the star quality rating in the CMF Clearinghouse different from the notations (bold, italics, etc.) in the Highway Safety Manual?
The star rating and the HSM notation have similarities but are notably different. Both indicate the same thing, which is a confidence in the CMF based on the quality of the study that produced it. In a rough sense, higher star ratings correspond to a bold face HSM notation and mid-range star ratings correspond to italics and asterisk HSM notations, but there is not a one-to-one comparison laid out between the two systems. The differences exist in the way the CMFs are reviewed to determine their quality.
The HSM review process applies an adjustment factor to the standard error from the study, and then assigns the bold and italic notations based on ranges of the adjusted standard error. The standard error is adjusted based mainly on the quality of the study design. The HSM assigns asterisk (*) or caret (^) notations based on the confidence interval of the CMF, which indicates how accurate the CMF estimate is.
The CMF Clearinghouse review process rates the CMF according to five categories — study design, sample size, standard error, potential bias, and data source — and judges the CMF according to its performance in each category. It assigns a star rating based on the cumulative performance in the five categories. It differs from the HSM process in that it does not attempt to adjust the standard error as the HSM does, and it more explicitly considers criteria such as data source, which examines whether a study used data from just one locality or from multiple locations across the state or nation.
How do I choose between CMFs in my search results that have the same star rating but different CMF values?
It's true that two or more CMFs for a particular countermeasure may have the same star rating but differing CMF values. It will be necessary for you to examine the information related to the applicability of the CMFs to determine how they differ. This could involve examining the brief data shown on the search results page (i.e., crash type, crash severity, roadway type, and area type) or looking at all the information about the CMFs by viewing the CMF details page for each one.
You should select the CMF that is most applicable to the situation in which you would like to apply the CMF (i.e., the characteristics associated with the CMF should closely match the characteristics of the scenario at hand). For example, CMFs often vary by crash type and crash severity. While it is useful to determine the change in crashes by type and severity, this should only be done when applicable CMFs are available for the specific crash type and severity of interest.
The figure below shows a snapshot of results for the countermeasure of "Installation of left-turn lane on single major road approach". You can see that the three CMFs listed in this figure all have 5-star ratings. However, the CMF values (0.65, 0.71, and 0.91) are all different.
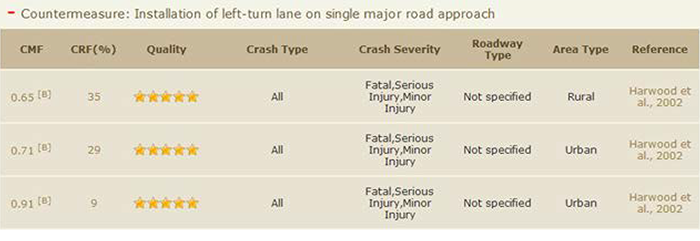
From this initial view of the search results, it is relatively easy to tell the difference between the first CMF and the other two. Although all three are similar in crash type, crash severity, and roadway type, the first one (CMF of 0.65) is identified as being developed for a "Rural" area type, whereas the other two were developed for an "Urban" area type.
However, all information given on the search results page is identical for the second and third CMF. Therefore, it is necessary to examine the details of each CMF (by clicking on the CMF value to go to the CMF details page). When the details of each CMF are examined, it can be seen that the CMF of 0.71 is intended for stop-controlled intersections, and the CMF of 0.91 is intended for signalized intersections.
It may be the case that two CMFs are exactly the same with respect to crash and roadway applicability. In these cases, it will be necessary to examine some of the other fields related to how and where the CMF was developed, such as:
1. Score details. The reviewers who established the star quality rating did so by giving scores of excellent, fair, or poor to five categories: study design, sample size, standard error, potential bias, and data source. Many CMFs in the Clearinghouse are accompanied by details of the scores behind the star rating as shown in the image below.

Clicking on the score details link will display a window showing the scores that the CMF received in each category. Users of the Clearinghouse may desire to examine the score details to compare two or more similar CMFs. For instance, although two CMFs may have received the same star rating, one may have a study design score of "Excellent" while the other is "Poor". It may be the case that a user may highly value study design and may use that category to decide between CMFs. Similarly, a user may prioritize some other category in their selection process and use that score to assist in selecting a CMF.
It may also be useful to examine the fields in the CMF details pertaining to the scores, specifically sample size and standard error. It may be the case that two CMFs both received a score of "Excellent" for sample size, but one has a sample size of 1,000 while the other has a sample size of 3,000. Both of these sample sizes are large enough to qualify for an "Excellent" rating, however, all other factors being equal, the larger sample size would be preferred. Likewise, two CMFs may have both received a score of "Poor" for standard error, but one has a standard error of 0.75 while the other has a standard error of 0.90. In this case, the smaller standard error would be preferred.
2. Similarity in locality of data used. The fields for "Municipality", "State", and "Country" indicate the area(s) from which data were used in developing the CMF. Many agencies prefer CMFs that were developed in locations that are similar or nearby to their own area, for reasons of terrain, weather, and other characteristics. For example, a state department of transportation in a mid-western state may prefer using a CMF developed in Kansas over a CMF developed in West Virginia.
3. Traffic volume range. The fields for "Major Road Traffic Volume" and "Minor Road Traffic Volume" indicate the range of traffic volumes that were used to develop the CMF. You should examine these fields to see which CMF has a traffic volume range that best fits your situation.
4. Age of data. The field for "Date Range of Data Used" indicates the age of the data used in developing the CMF. Generally speaking, more recent data would be preferred (all other factors being equal). Studies conducted more recently typically use more advanced techniques, higher precision data, and have other advantages related to the progression of knowledge, data quality, and study methods that develop over time in the field of highway safety research. More recent data will also better reflect changes in vehicle fleet characteristics and technology.
5. Original study report. In addition to providing the citation of the study, the Clearinghouse provides a link, where possible, to the original study document for any CMF. This original document will typically be the final report or published article on the study that developed the CMF. A user of the Clearinghouse who is attempting to select between two similar CMFs may find it useful to refer to the original study report to understand the background of the CMF development. There may be details in the study report that would assist in the CMF selection process. Although the Clearinghouse contains extensive data for each CMF, it does not contain every detail from the study report. For example, the report may discuss details about the roadside character of the roads used in the CMF development. If the roadside character is significantly different from the roads in the user's jurisdiction, he or she may decide to select another CMF that was developed on roads with more similar roadside character to his or her jurisdiction.
The CMF Clearinghouse presents both Crash Modification Factors and Crash Reduction Factors. What's the difference?
The main difference between CRF and CMF is that CRF provides an estimate of the percentage reduction in crashes, while CMF is a multiplicative factor used to compute the expected number of crashes after implementing a given improvement. Both terms are presented in the Clearinghouse because both are widely used in the field of traffic safety.
Mathematically stated, CMF = 1 - (CRF/100). For example, if a particular countermeasure is expected to reduce the number of crashes by 23% (i.e., the CRF is 23), the CMF will be 1 - (23/100) = 0.77. On the other hand, if the treatment is expected to increase the number of crashes by 23% (i.e., the CRF is -23), the CMF will be = 1 - (-23/100) = 1.23.
These reduction estimates might also be expressed as a function. Crash reduction and crash modification factors are constants; crash modification functions allow the factor to vary for different scenarios, such as for different traffic volume scenarios.
How do the Clearinghouse crash severity terms Fatal, Serious Injury, and Minor Injury relate to the KABCO injury scale?
The initial idea was to use a standard KABCO scale for the Clearinghouse, but the problem encountered was one that always affects the attempts to standardize or categorize study details in the Clearinghouse database. The issue is that authors can and do report the details of their CMFs in many different ways. For crash severity, authors have been seen to report crash severity by KABCO, by MAIS, or simply by referring to "serious injury" and "minor injury". Thus, the Clearinghouse uses the lowest common denominator. There is no one-to-one comparison with KABCO, but the best comparison is that "Fatal" is always equivalent to K, "Serious Injury" would generally be A and B injuries, and "Minor Injury" would generally be C injuries.
How are states using the CMF Clearinghouse?
Many states refer to the CMF Clearinghouse for information on CMFs, traditional and new countermeasures, and other resources related to using CMFs. Although CMFs have been typically used for prioritizing safety projects and developing estimates in cost-benefit analysis, some states are beginning to use CMFs in other situations, such as design exceptions and alternatives analysis.
PLANSAFE
Does PLANSAFE Implement the Highway Safety Manual?
PLANSAFE - a software tool developed to complement NCHRP Report 546, Incorporating Safety into Long Range Transportation Planning - supports regional and statewide safety planning efforts. It does not implement portions of the Highway Safety Manual or overlap with the functionality of IHSDM or SafetyAnalyst. While PLANSAFE could be used for analysis of changes in individual locations, the level of detail needed to make decisions at this level is not supported by PLANSAFE, as the documentation for the tool cautions. For more information, refer to NCHRP Report 546 or the web page for NCHRP Project 8-44(02), under which PLANSAFE was developed.
References and Resources
- AASHTO. Highway Safety Manual website:
www.HighwaySafetyManual.org.
-
Crash Modification Factors in Practice: Quantifying Safety in the Roadway Safety Management Process. Publication FHWA-SA-13-010, Federal Highway Administration, Washington, D.C., 2013. Available online at:
http://safety.fhwa.dot.gov/tools/crf/resources/cmfs/docs/management.pdf
-
Highway Safety Improvement Program (HSIP) Manual. Publication FHWA-SA-09-029, Federal Highway Administration, Washington, DC, 2010.
- National Cooperative Highway Research Program (NCHRP).
NCHRP Report500 Series: Guidance for Implementation of the AASHTO Strategic Highway Safety Plan, Volumes 1-20. Transportation Research Board, Washington, DC, 2004. Available online at:
http://www.trb.org/Main/Blurbs/152868.aspx
- Gross, F., Persaud, B., and C. Lyon.
A Guide to Developing Quality Crash Modification Factors. Publication FHWA-SA-10-032, Federal Highway Administration, Washington, D.C., 2010. Available online at:
http://safety.fhwa.dot.gov/tools/crf/resources/fhwasa10032/
- Carter, D., R. Srinivasan, F. Gross, and F. Council.
Recommended Protocols for Developing Crash Modification Factors. National Cooperative Highway Research Program, Transportation Research Board, February 2012.
-
Introduction to Crash Modification Factors. Publication FHWA-SA-13-015, Federal Highway Administration, Washington, D.C., 2013. Available online at:
http://safety.fhwa.dot.gov/tools/crf/resources/cmfs/docs/intro.pdf
- Gross, F. and Yunk, K. “Crash Modification Factors: An Overview of Its Applications.”
Public Roads. Federal Highway Administration, Washington, D.C., 2011.
- Gross, F., Hamidi, A., and Yunk, K.
Investigation of Existing and Alternative Methods for Combining Multiple CMFs. Federal Highway Administration, Washington, D.C., 2011.
-
Introduction to Safety Performance Functions. Publication FHWA-SA-13-016, Federal Highway Administration, Washington, D.C., 2013. Available online at:
http://safety.fhwa.dot.gov/tools/crf/resources/cmfs/docs/safety_performance_funtions.pdf
- National Cooperative Highway Research Program (NCHRP).
NCHRP 17-50 Lead States Initiative for Implementing the Highway Safety Manual. Transportation Research Board, Washington D.C., August 2014.
- National Cooperative Highway Research Program (NCHRP). NCHRP HR 20-7(332):
User’s Guide to Develop Highway Safety Manual Safety Performance Function Calibration Factors. NAVIGATS Inc., January 2014.
- Federal Highway Administration (FHWA).
Performance-Based Practical Design: Frequently Asked Questions. April, 2017
https://www.fhwa.dot.gov/design/pbpd/general_information/faqs.cfm
- FHWA. The Calibrator Tool website:
https://safety.fhwa.dot.gov/rsdp/toolbox-content.aspx?toolid=150
- SafetyAnalyst website:
www.safetyanalyst.org.
- IHSDM software download website:
www.ihsdm.org.
- CMF Clearinghouse website:
www.cmfclearinghouse.org.
- Srinivasan, R., D. Carter, and K. Bauer. Safety Performance Function Decision Guide: SPF Calibration vs. SPF Development. Report No. FHWA-SA-14-004. Federal Highway Administration, Washington, D.C., September 2013.
- Srinivasan, R., and K. Bauer.
Safety Performance Function Development Guide: Developing Jurisdiction-Specific SPFs. Report No. FHWA-SA-14-005. Federal Highway Administration, Washington, D.C., September 2013.
- Bonneson, J., S. Geedipally, M. Pratt, and D. Lord.
Safety Prediction Methodology and Analysis Tool for Freeways and Interchanges. Final Report. NCHRP Project 17-45. Texas Transportation Institute, College Station, Texas, 2012.
http://onlinepubs.trb.org/onlinepubs/nchrp/docs/NCHRP17-45_FR.pdf
- FHWA. “Safer Roads through Better Design – using the IHSDM” (FHWA-SA-17-011). Accessed from:
https://www.fhwa.dot.gov/research/tfhrc/projects/safety/comprehensive/ihsdm/fhwasa17011.pdf
- FHWA. “Quick Start Guide to Using CMFs” (FHWA-SA-17-007). Accessed from:
https://safety.fhwa.dot.gov/rsdp/downloads/fhwasa17007.pdf
- AASHTOWare. SafetyAnalyst website:
https://developer.safetyanalyst.org/aashto/index.php/AASHTOWare_Safety_Analyst
- FHWA. IHSDM website:
https://www.fhwa.dot.gov/research/tfhrc/projects/safety/comprehensive/ihsdm/index.cfm
